---
title: "14 · Haplotype Composition"
subtitle: "Stacked bar charts of intra-host haplotype frequencies"
description: |
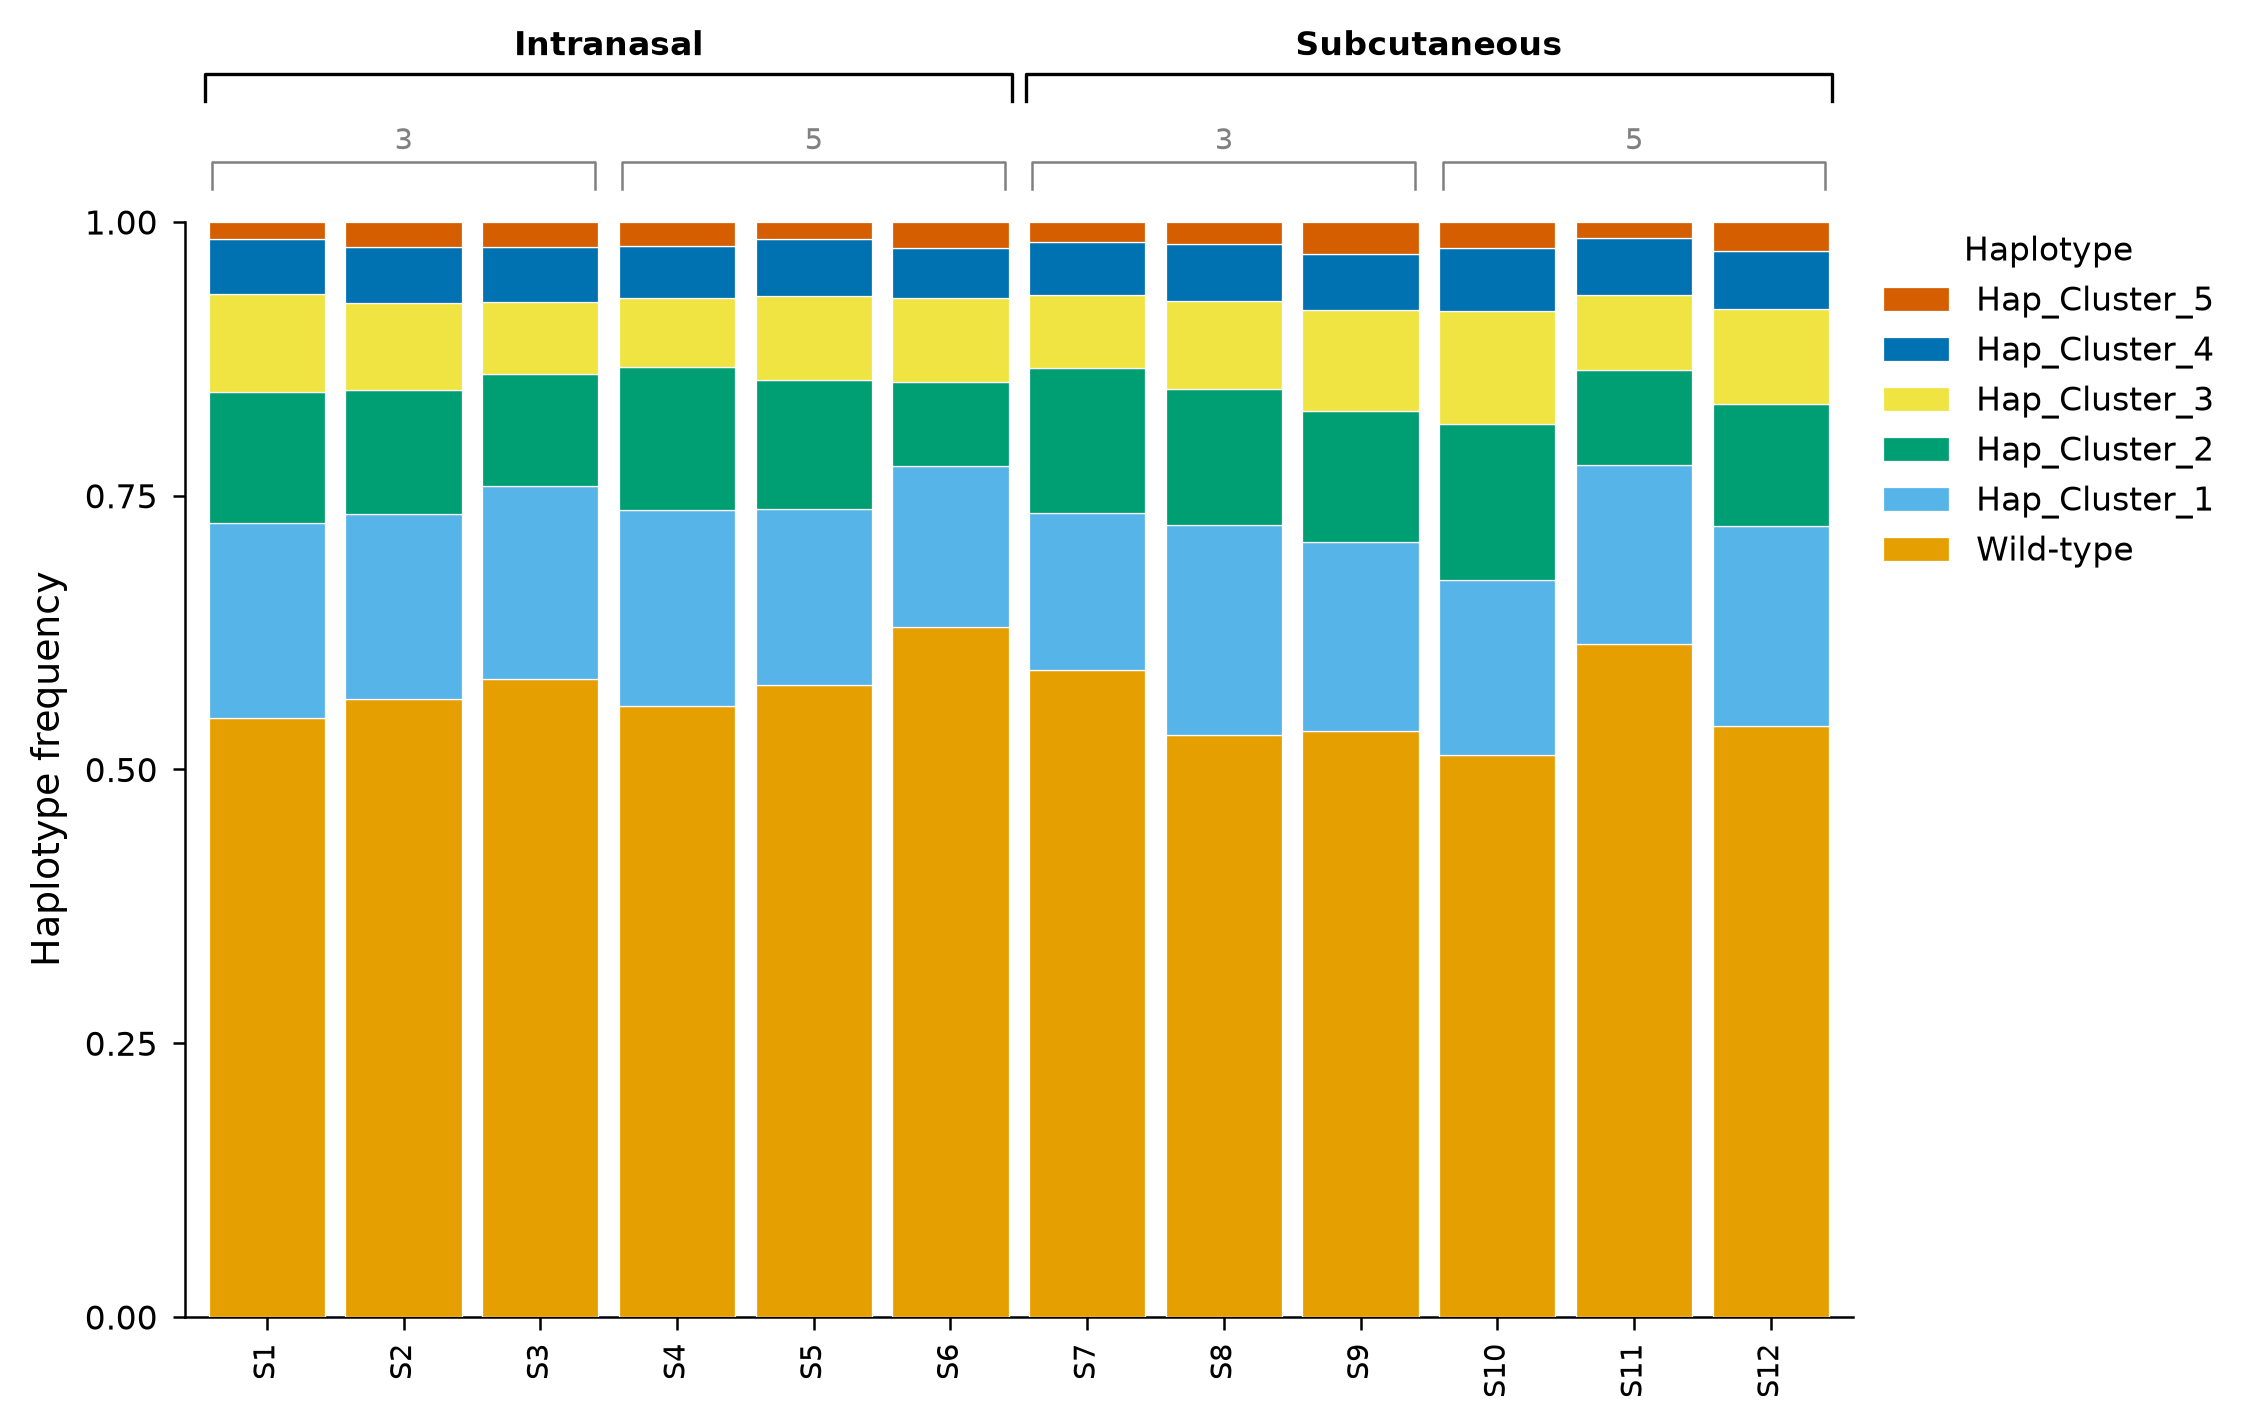
Loads per-sample haplotype-frequency tables and a sample manifest, orders samples
by route/DPI/replicate, and produces publication-quality stacked bar charts with
Okabe-Ito colourblind-safe colours and route/DPI group brackets.
categories: [genomics, virology, haplotype, intra-host]
jupyter: python3
---
## Overview
| Item | Details |
|------|---------|
| **Input** | `haplotype_frequencies.csv` (sample, haplotype, frequency) · `manifest.csv` (sample_id, route, dpi, replicate) |
| **Key packages** | `pandas`, `matplotlib`, `numpy` |
| **Statistics** | None — descriptive visualisation only |
| **Output** | Stacked bar chart (PNG · SVG) |
| **Download** | [template.qmd](template.qmd) |
Edit `ROUTE_ORDER` to control the left-to-right ordering of route groups. Edit `DPI_ORDER`
to control the sort order of DPI values within each route. Any route, DPI or replicate
value found in the manifest but missing from these lists raises an error rather than
being silently dropped from the figure. The `Okabe-Ito` palette is colourblind-safe by
default; assign explicit colours in `HAPLOTYPE_COLORS` to override.
[← Gallery](../../index.html){.btn .btn-outline-secondary}
[Download .qmd](template.qmd){.btn .btn-primary}
---
## User Configuration
```{python}
#| label: user-config
# ── USER CONFIGURATION ────────────────────────────────────────────────────────

# Paths relative to this notebook
HAPLOTYPE_CSV = "data/haplotype_frequencies.csv"
MANIFEST_CSV  = "data/manifest.csv"

# Control sample ordering. Every value present in the manifest must appear in the
# corresponding list, or the guard in "Prepare Data" raises — set a list to None to
# derive the order from the data instead.
ROUTE_ORDER   = ["Intranasal", "Subcutaneous"]
DPI_ORDER     = None          # list of ints (e.g. [1, 3, 5]) or None for numeric sort
REPLICATE_ORDER = None        # list or None for natural sort

# Haplotypes to treat as reference (plotted first, labelled "Ref")
REF_HAPLOTYPE  = "Wild-type"

# Okabe-Ito colourblind-safe palette (7 colours) — haplotypes cycle through these
OKABE_ITO = [
    "#E69F00", "#56B4E9", "#009E73", "#F0E442",
    "#0072B2", "#D55E00", "#CC79A7",
]

# Override specific haplotype colours (key = haplotype name, value = hex colour)
HAPLOTYPE_COLORS = {}   # e.g. {"Wild-type": "#000000", "H1": "#E69F00"}

# Tolerance on "haplotype frequencies sum to 1.0 per sample" (warning only)
STACK_TOTAL_TOL = 0.01

# Bar and layout
BAR_WIDTH      = 0.85
DPI_GAP        = 0.05    # extra gap between DPI groups (in bar-width units)

# Output directory
OUTPUT_DIR = "outputs"

# ─────────────────────────────────────────────────────────────────────────────
```
## Setup
```{python}
#| label: setup
import os
import warnings
from itertools import cycle

import numpy as np
import pandas as pd
import matplotlib.pyplot as plt
from matplotlib.transforms import blended_transform_factory

os.makedirs(OUTPUT_DIR, exist_ok=True)

# ── Publication styling ──────────────────────────────────────────────────────
# Reproducible SVG output: matplotlib stamps a wall-clock date and randomly
# generated element IDs into every SVG, so re-rendering an unchanged figure
# produced a large but meaningless git diff. A fixed salt and a fixed
# SOURCE_DATE_EPOCH make repeat renders byte-identical.
os.environ.setdefault("SOURCE_DATE_EPOCH", "1735689600")   # 2025-01-01 UTC
plt.rcParams["svg.hashsalt"] = "lab-bioinfo-templates"

plt.rcParams.update({
    "font.family":     "sans-serif",
    "font.sans-serif": ["Arial", "Helvetica", "DejaVu Sans"],
    "font.size":       8,
    "axes.titlesize":  10,
    "axes.labelsize":  9,
    "xtick.labelsize": 8,
    "ytick.labelsize": 8,
    "legend.fontsize": 8,
    "figure.facecolor": "white",
    "axes.facecolor":   "white",
    "axes.edgecolor":   "black",
    "axes.linewidth":   0.6,
    "axes.grid":        False,
    "grid.alpha":       0,
    "xtick.major.width":   0.6,
    "ytick.major.width":   0.6,
    "xtick.major.size":    3,
    "ytick.major.size":    3,
    "savefig.dpi":      600,
    "savefig.bbox":     "tight",
    "savefig.facecolor": "white",
})

print(f"Figures will be saved to: {os.path.abspath(OUTPUT_DIR)}")
```
## Load Data
```{python}
#| label: load-data
def require_columns(df, required, name):
    """Fail loudly if an input table is missing a column the analysis depends on."""
    missing = set(required) - set(df.columns)
    if missing:
        raise ValueError(
            f"{name} is missing required column(s): {sorted(missing)}. "
            f"Found: {list(df.columns)}"
        )

freq_df = pd.read_csv(HAPLOTYPE_CSV)
manifest_df = pd.read_csv(MANIFEST_CSV)

require_columns(freq_df, ["sample_id", "haplotype", "frequency"], HAPLOTYPE_CSV)
require_columns(manifest_df, ["sample_id", "route", "dpi", "replicate"], MANIFEST_CSV)

if manifest_df["sample_id"].duplicated().any():
    dupes = manifest_df.loc[manifest_df["sample_id"].duplicated(), "sample_id"].tolist()
    raise ValueError(f"{MANIFEST_CSV} has duplicate sample_id rows: {sorted(set(dupes))}")

print(f"Haplotype frequencies: {freq_df.shape[0]} rows, {freq_df.shape[1]} columns")
print(f"  Columns: {list(freq_df.columns)}")
print(f"Manifest: {manifest_df.shape[0]} samples")
print(f"  Columns: {list(manifest_df.columns)}")

freq_df.head()
```
## Prepare Data
```{python}
#| label: prepare-data
df = freq_df.merge(manifest_df, on="sample_id", how="left", validate="many_to_one")

# Every frequency row must have found its manifest entry.
unmatched = sorted(df.loc[df["route"].isna(), "sample_id"].unique())
if unmatched:
    raise ValueError(
        f"{len(unmatched)} sample_id(s) in {HAPLOTYPE_CSV} have no row in "
        f"{MANIFEST_CSV}: {unmatched}"
    )

# ── Order samples: route → DPI → replicate ───────────────────────────────────
route_order   = ROUTE_ORDER if ROUTE_ORDER else sorted(df["route"].dropna().unique())
dpi_order     = DPI_ORDER if DPI_ORDER else sorted(df["dpi"].dropna().unique())
repl_order    = REPLICATE_ORDER if REPLICATE_ORDER else sorted(df["replicate"].dropna().unique())

# Guard: pd.Categorical turns any value outside `categories` into NaN, which would
# drop those samples from the sort, the brackets and (silently) the figure. Refuse
# to continue instead.
for col, order, cfg_name in [
    ("route",     route_order, "ROUTE_ORDER"),
    ("dpi",       dpi_order,   "DPI_ORDER"),
    ("replicate", repl_order,  "REPLICATE_ORDER"),
]:
    observed = set(df[col].dropna().unique())
    unconfigured = sorted(observed - set(order), key=str)
    if unconfigured:
        raise ValueError(
            f"{cfg_name} does not list every '{col}' value present in {MANIFEST_CSV}: "
            f"{unconfigured} would be dropped from the figure. "
            f"Configured: {list(order)}. Add the missing value(s), or set "
            f"{cfg_name} = None to derive the order from the data."
        )

df["route"]     = pd.Categorical(df["route"],     categories=route_order,   ordered=True)
df["dpi"]       = pd.Categorical(df["dpi"],       categories=dpi_order,     ordered=True)
df["replicate"] = pd.Categorical(df["replicate"], categories=repl_order,    ordered=True)

df = df.sort_values(["route", "dpi", "replicate", "sample_id"])

sample_order = df[["sample_id", "route", "dpi", "replicate"]].drop_duplicates()
sample_order = sample_order.sort_values(["route", "dpi", "replicate", "sample_id"])
sample_list  = sample_order["sample_id"].tolist()

print(f"Ordered samples ({len(sample_list)}):")
for sid in sample_list:
    info = sample_order[sample_order["sample_id"] == sid].iloc[0]
    print(f"  {sid}  →  route={info['route']}  dpi={info['dpi']}  replicate={info['replicate']}")
```
## Assign Haplotype Colours
```{python}
#| label: assign-colours
haplotypes_in_data = sorted(df["haplotype"].dropna().unique())

# Ensure reference haplotype comes first
ordered_haplotypes = []
if REF_HAPLOTYPE in haplotypes_in_data:
    ordered_haplotypes.append(REF_HAPLOTYPE)
for h in haplotypes_in_data:
    if h != REF_HAPLOTYPE:
        ordered_haplotypes.append(h)

# Assign colours: explicit overrides first, then cycle through Okabe-Ito
colour_cycle = cycle(OKABE_ITO)
haplotype_colour_map = {}
for h in ordered_haplotypes:
    if h in HAPLOTYPE_COLORS:
        haplotype_colour_map[h] = HAPLOTYPE_COLORS[h]
    else:
        haplotype_colour_map[h] = next(colour_cycle)

print("Haplotype colour map:")
for h, c in haplotype_colour_map.items():
    print(f"  {h:30s} → {c}")
```
## Build Stacked Bar Chart
```{python}
#| label: stacked-bar
#| fig-width: 12
#| fig-height: 5
n_samples = len(sample_list)
fig, ax = plt.subplots(figsize=(max(8, n_samples * 0.5), 5))

# ── Draw stacked bars ────────────────────────────────────────────────────────
# Wide matrix: rows = sample (in display order), columns = haplotype.
freq_matrix = (
    df.pivot_table(index="sample_id", columns="haplotype", values="frequency",
                   aggfunc="sum", fill_value=0.0)
      .reindex(index=sample_list, columns=ordered_haplotypes, fill_value=0.0)
)

bar_positions = np.arange(n_samples)
bottom = np.zeros(n_samples)   # running stack height — without this the bars overlay

for h in ordered_haplotypes:
    freqs = freq_matrix[h].to_numpy(dtype=float)
    ax.bar(
        bar_positions,
        freqs,
        BAR_WIDTH,
        bottom=bottom,
        label=h,
        color=haplotype_colour_map[h],
        edgecolor="white",
        linewidth=0.3,
        zorder=3,
    )
    bottom += freqs

# Frequencies are expected to be compositional (one sample = 1.0). Warn rather than
# fail so partial haplotype sets still plot, but never let a bar run off the axis.
stack_totals = freq_matrix.sum(axis=1)
print(f"Stack totals per sample: min {stack_totals.min():.4f}, "
      f"max {stack_totals.max():.4f}")
off = stack_totals[(stack_totals - 1.0).abs() > STACK_TOTAL_TOL]
if len(off):
    warnings.warn(
        f"{len(off)} sample(s) have haplotype frequencies that do not sum to 1.0 "
        f"(tolerance {STACK_TOTAL_TOL}): {off.round(4).to_dict()}",
        stacklevel=2,
    )

# ── X-axis labels ────────────────────────────────────────────────────────────
ax.set_xticks(bar_positions)
ax.set_xticklabels(sample_list, rotation=90, ha="center", fontsize=7)
ax.set_xlim(-0.6, n_samples - 0.4)

# ── Axis styling ─────────────────────────────────────────────────────────────
ax.set_ylabel("Haplotype frequency")
# Frequencies are normalised to sum to 1.0 per sample, so the axis stops at 1.0.
# The group brackets are drawn above the axes in figure-relative coordinates
# (see below) rather than by inflating the limit, which would put a "1.2" tick
# on an axis that cannot exceed 1.0.
y_top = max(1.0, float(stack_totals.max()))
ax.set_ylim(0, y_top)
ax.set_yticks(np.linspace(0, 1.0, 5))
ax.spines["top"].set_visible(False)
ax.spines["right"].set_visible(False)

# ── Legend outside right ─────────────────────────────────────────────────────
handles, labels = ax.get_legend_handles_labels()
# Reverse to match bar stacking order (reference at bottom)
ax.legend(
    reversed(handles),
    reversed(labels),
    loc="upper left",
    bbox_to_anchor=(1.01, 1.0),
    frameon=False,
    title="Haplotype",
    title_fontsize=8,
    borderaxespad=0,
)

# ── Group brackets ───────────────────────────────────────────────────────────
sample_meta = sample_order.reset_index(drop=True)

# Build mapping: bar index → (route, dpi)
bar_info = list(zip(sample_meta["route"].astype(str), sample_meta["dpi"].tolist()))

# --- Route brackets (top level) ---
route_groups = {}
for i, (route, dpi) in enumerate(bar_info):
    route_groups.setdefault(route, []).append(i)

# Bracket geometry in *axes fraction* on y (1.0 = top of the plotting area) and
# data coordinates on x, so the data y-limit stays at 0–1.
bracket_trans   = blended_transform_factory(ax.transData, ax.transAxes)
bracket_y_dpi   = 1.03
bracket_y_route = 1.11
tick_height     = 0.025

# Find contiguous route blocks
route_ranges = []
for route in route_order:
    indices = route_groups.get(route, [])
    if not indices:
        continue
    start, end = min(indices), max(indices)
    route_ranges.append((route, start, end))

# Draw route brackets
for route, start, end in route_ranges:
    x0, x1 = start - 0.45, end + 0.45
    bracket_y = bracket_y_route
    ax.plot([x0, x0, x1, x1], [bracket_y, bracket_y + tick_height, bracket_y + tick_height, bracket_y],
            color="black", linewidth=0.8, clip_on=False, transform=bracket_trans)
    ax.text((x0 + x1) / 2, bracket_y + tick_height + 0.01, route,
            ha="center", va="bottom", fontsize=8, fontweight="bold", clip_on=False,
            transform=bracket_trans)

# --- DPI sub-brackets ---
dpi_groups = {}
for i, (route, dpi) in enumerate(bar_info):
    dpi_groups.setdefault((route, dpi), []).append(i)

for route in route_order:
    for dpi_val in dpi_order:
        key = (route, dpi_val)
        if key not in dpi_groups:
            continue
        indices = dpi_groups[key]
        start, end = min(indices), max(indices)
        x0, x1 = start - 0.4, end + 0.4
        bracket_y = bracket_y_dpi
        ax.plot([x0, x0, x1, x1], [bracket_y, bracket_y + tick_height, bracket_y + tick_height, bracket_y],
                color="grey", linewidth=0.6, clip_on=False, transform=bracket_trans)
        ax.text((x0 + x1) / 2, bracket_y + tick_height + 0.005, str(dpi_val),
                ha="center", va="bottom", fontsize=7, color="grey", clip_on=False,
                transform=bracket_trans)

# ── Leave room above the axes for the brackets (they sit outside it) ─────────
plt.subplots_adjust(right=0.82, top=0.84)
plt.show()
```
## Save Outputs
```{python}
#| label: save-outputs
png_path = os.path.join(OUTPUT_DIR, "haplotype_composition.png")
svg_path = os.path.join(OUTPUT_DIR, "haplotype_composition.svg")

fig.savefig(png_path, dpi=600)
fig.savefig(svg_path)

print(f"Saved: {os.path.abspath(png_path)}")
print(f"Saved: {os.path.abspath(svg_path)}")
```
---
::: {.callout-tip}
**When to use this template:** You have per-sample haplotype frequency data
(e.g., from variant calling or amplicon deep sequencing) and a sample manifest
with route/DPI/replicate metadata, and you want to visualise the intra-host
haplotype composition across your experiment.
:::
::: {.callout-note}
**Colour palette:** Defaults to the Okabe-Ito colourblind-safe palette (7 colours).
If you have fewer haplotypes the palette will cycle — override in `HAPLOTYPE_COLORS`.
**Sample ordering:** Samples are sorted by route (left to right), then DPI, then
replicate. Edit `ROUTE_ORDER`, `DPI_ORDER`, and `REPLICATE_ORDER` to control the
order explicitly.
:::