---
title: "13 · Selection Pressure (πN - πS)"
subtitle: "Per-gene selection pressure bar plots with Kruskal–Wallis BH FDR"
description: |
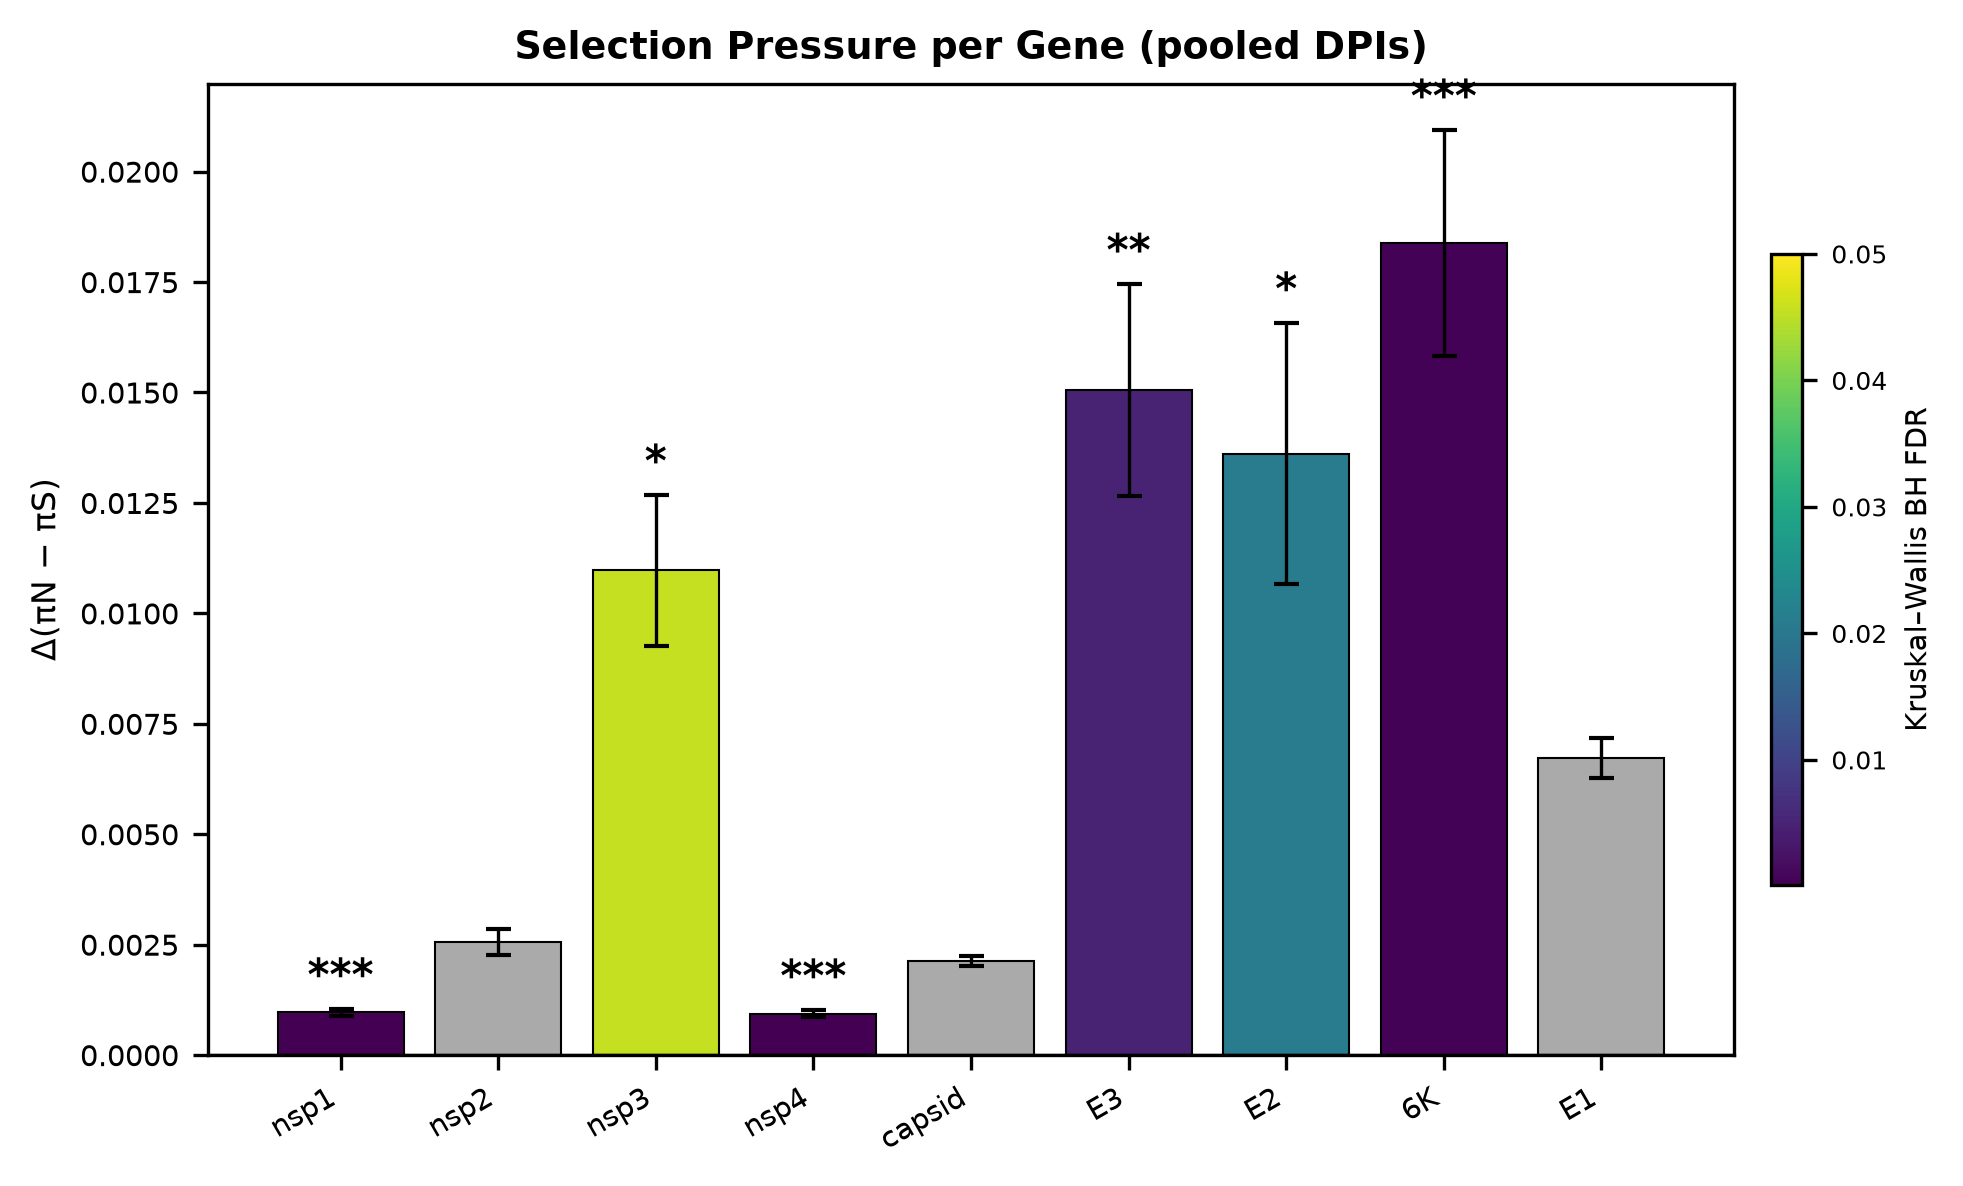
Computes per-gene mean Δ(πN−πS) pooled across all DPI timepoints, tests each gene
against the rest of the genome with a Kruskal–Wallis test, corrects across genes
with Benjamini–Hochberg, maps bar colour to the resulting FDR via viridis, overlays
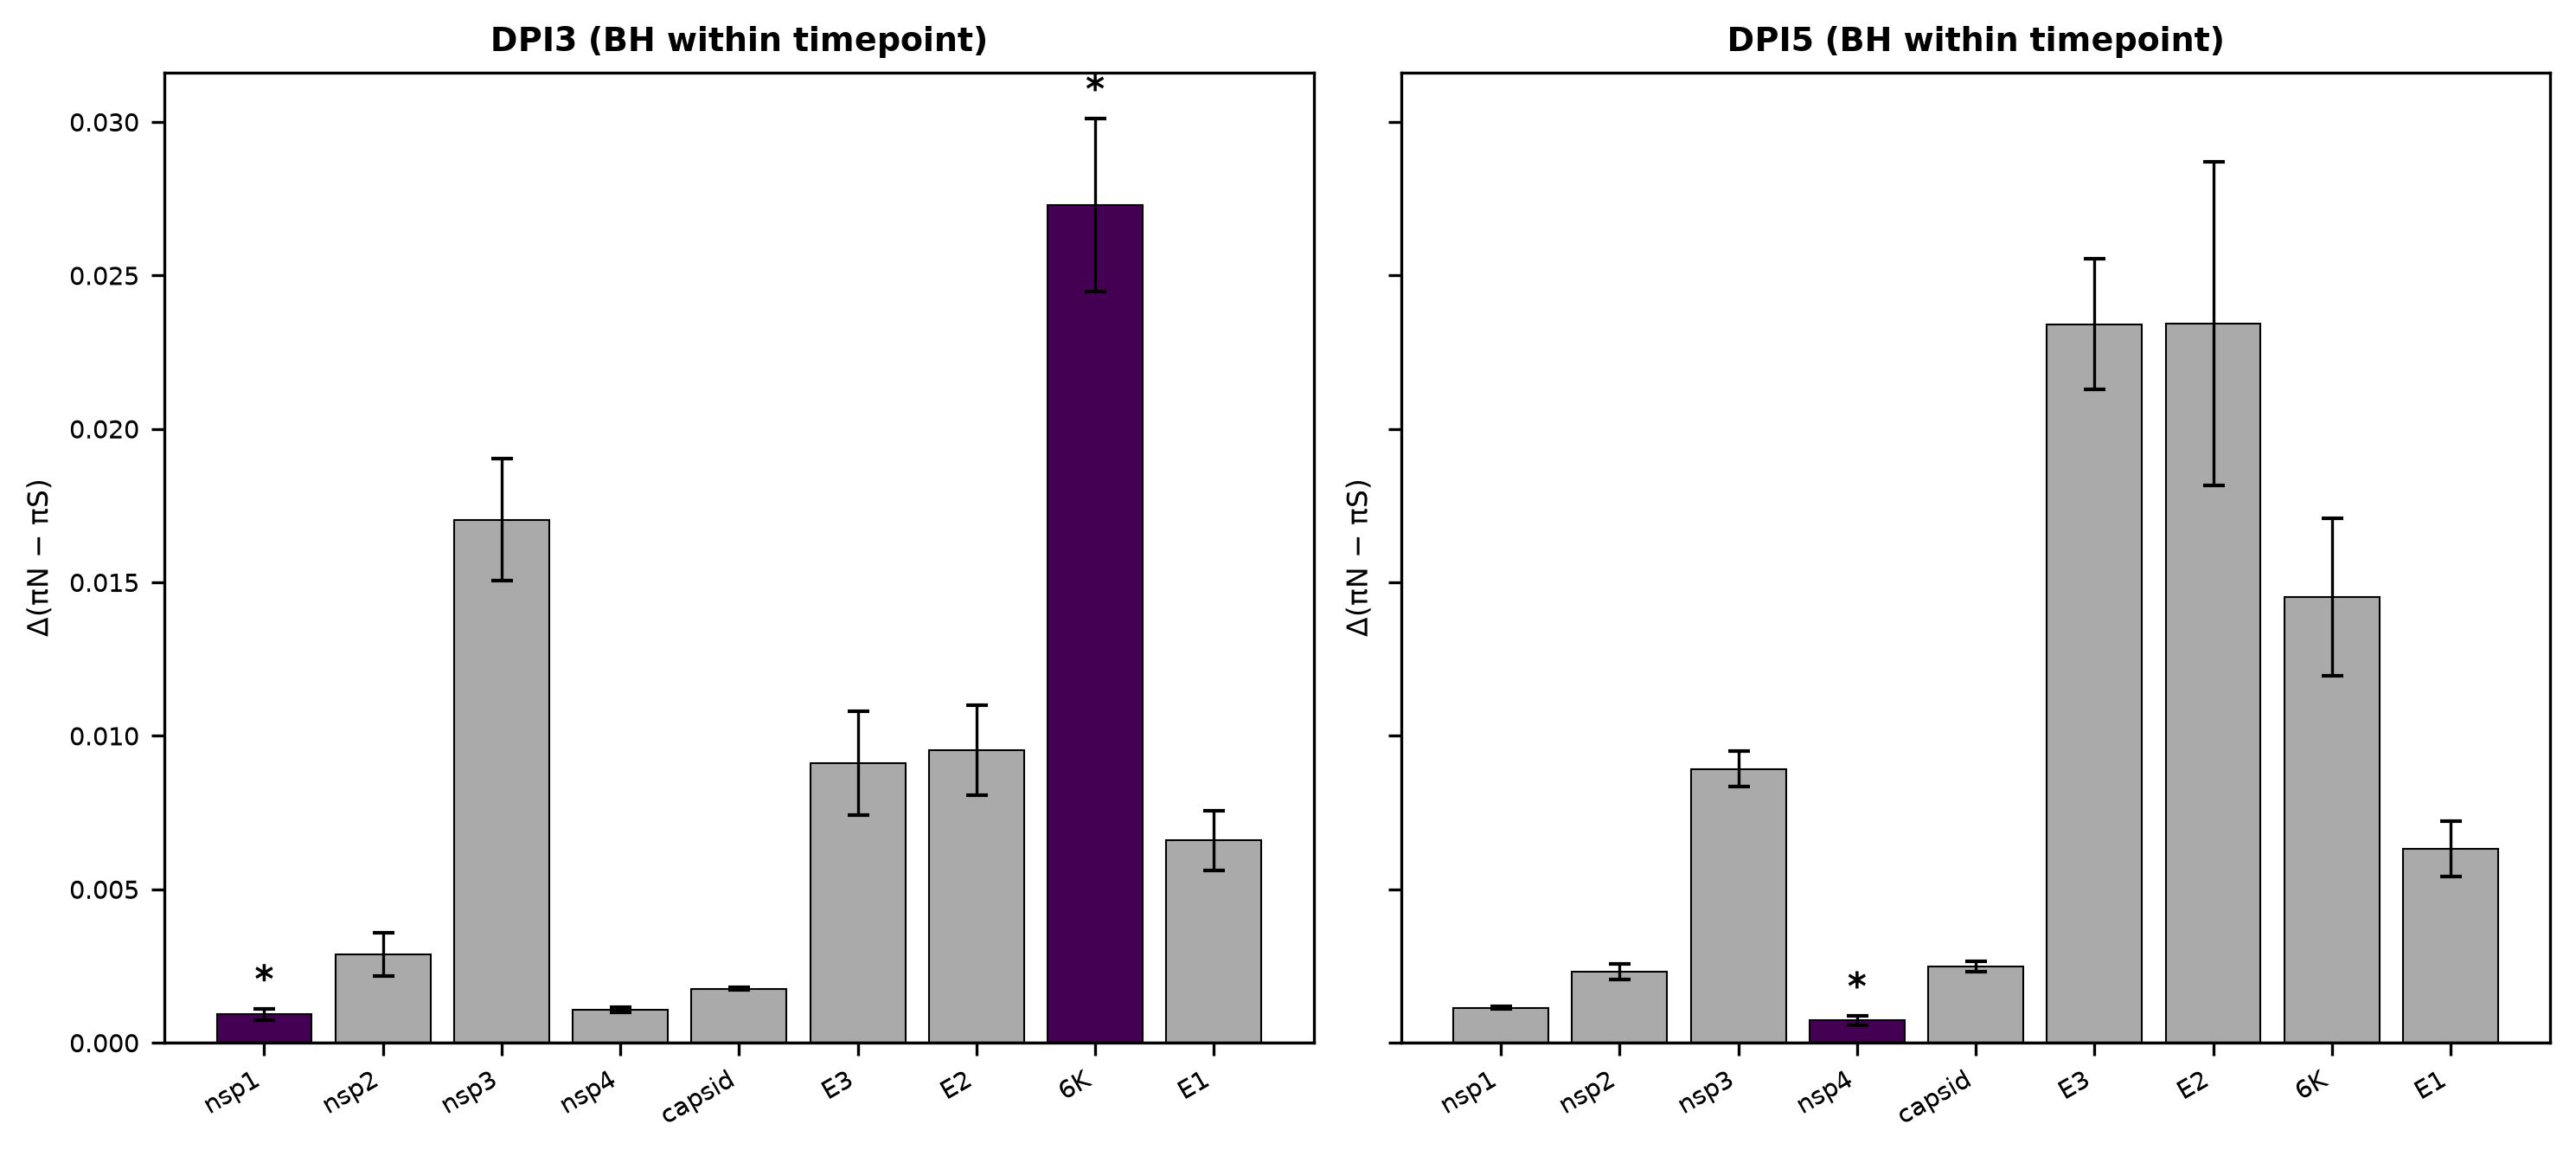
significance stars (∗∗∗ / ∗∗ / ∗), produces a stacked DPI panel with its own
per-timepoint correction, and exports publication-ready PNG + SVG figures.
categories: [genomics, virology, selection, piN-piS, evolution]
jupyter: python3
---
## Overview
| Item | Details |
|------|---------|
| **Input** | `delta_per_sample.csv` · `selection_gene_key.csv` (in `data/`) |
| **Key packages** | `pandas`, `numpy`, `matplotlib`, `scipy` |
| **Statistics** | Mean ± SEM · per-gene Kruskal–Wallis (gene vs. rest of genome) · Benjamini–Hochberg FDR |
| **Output** | `selection_pressure_bar.png/.svg` · `selection_pressure_stacked_dpi.png/.svg` · `selection_pressure_summary.csv` |
| **Download** | [template.qmd](template.qmd) |
Edit `GENE_ORDER` if your pathogen uses a different gene / protein name ordering. The
default palette maps `FDR ≥ 0.05` bars to grey; significant bars use the viridis
colormap scaled from the minimum observed FDR to 0.05.
**What the test is.** For each gene, the per-sample Δ(πN−πS) values for that gene are
compared against the pooled per-sample Δ values of every other gene using a
Kruskal–Wallis test, and the resulting p-values are corrected across genes with
Benjamini–Hochberg. A star therefore means *"this gene's Δ differs from the rest of the
genome"*. The test is two-sided: a gene with unusually **low** Δ can be flagged just as
a gene with unusually high Δ can. Nothing in `data/` carries a pre-computed p-value —
every statistic on this page is calculated below.
[← Gallery](../../index.html){.btn .btn-outline-secondary}
[Download .qmd](template.qmd){.btn .btn-primary}
---
## User Configuration
```{python}
#| label: user-config
GENE_ORDER = ["nsp1", "nsp2", "nsp3", "nsp4", "capsid", "E3", "E2", "6K", "E1"]

DELTA_COLUMN     = "delta_piN_minus_piS"  # per-sample effect column to test
FDR_ALPHA        = 0.05                   # significance threshold for colour/star
FDR_STAR_THRESH  = [0.001, 0.01, 0.05]    # *** / ** / *  (ascending)
DPI_PANEL_LABELS = ["dpi3", "dpi5"]

OUTPUT_DIR = "outputs"
DPI_EXPORT = 300
```
## Setup
```{python}
#| label: setup
import os
import warnings

import numpy as np
import pandas as pd
import matplotlib.pyplot as plt
from scipy.stats import kruskal, false_discovery_control

# Only silence the "mean of empty slice"-style RuntimeWarnings that a gene with a
# single sample can raise; everything else stays visible on purpose.
warnings.filterwarnings("ignore", category=RuntimeWarning,
                        message="Degrees of freedom <= 0")

# ── Publication matplotlib style ──────────────────────────────────────────
# Reproducible SVG output: matplotlib stamps a wall-clock date and randomly
# generated element IDs into every SVG, so re-rendering an unchanged figure
# produced a large but meaningless git diff. A fixed salt and a fixed
# SOURCE_DATE_EPOCH make repeat renders byte-identical.
os.environ.setdefault("SOURCE_DATE_EPOCH", "1735689600")   # 2025-01-01 UTC
plt.rcParams["svg.hashsalt"] = "lab-bioinfo-templates"

plt.rcParams.update({
    "font.family":      "sans-serif",
    "font.sans-serif":  ["Arial", "Helvetica", "DejaVu Sans"],
    "font.size":        8,
    "axes.titlesize":   9,
    "axes.labelsize":   8,
    "xtick.labelsize":  7,
    "ytick.labelsize":  7,
    "legend.fontsize":  7,
    "figure.facecolor": "white",
    "axes.facecolor":   "white",
    "axes.edgecolor":   "black",
    "axes.linewidth":   0.8,
    "axes.grid":        False,
    "grid.alpha":       0.0,
    "xtick.color":      "black",
    "ytick.color":      "black",
    "svg.fonttype":     "none",
})

os.makedirs(OUTPUT_DIR, exist_ok=True)
print(f"Outputs will be saved to: {os.path.abspath(OUTPUT_DIR)}")
```
## Load Data
```{python}
#| label: load-data
def require_columns(df, required, name):
    """Fail loudly if an input table is missing a column the analysis depends on."""
    missing = set(required) - set(df.columns)
    if missing:
        raise ValueError(
            f"{name} is missing required column(s): {sorted(missing)}. "
            f"Found: {list(df.columns)}"
        )

delta_df = pd.read_csv("data/delta_per_sample.csv")
gene_key = pd.read_csv("data/selection_gene_key.csv")

require_columns(delta_df, ["sample", "dpi", "product", "piN", "piS", DELTA_COLUMN],
                "data/delta_per_sample.csv")
require_columns(gene_key, ["product", "mean_delta"], "data/selection_gene_key.csv")

print(f"Loaded delta_per_sample.csv  — {len(delta_df)} rows, columns: {list(delta_df.columns)}")
print(f"Loaded selection_gene_key.csv — {len(gene_key)} rows,  columns: {list(gene_key.columns)}")

# The delta column must genuinely be piN − piS; catch upstream drift early.
delta_check = (delta_df["piN"] - delta_df["piS"] - delta_df[DELTA_COLUMN]).abs().max()
assert delta_check < 1e-6, (
    f"'{DELTA_COLUMN}' does not equal piN - piS (max discrepancy {delta_check:.3g})."
)

# Warn about genes present in the data but absent from GENE_ORDER: they would be
# dropped from every figure and table below without this notice.
genes_in_data = set(delta_df["product"].unique())
unlisted = sorted(genes_in_data - set(GENE_ORDER))
if unlisted:
    warnings.warn(
        f"{len(unlisted)} gene(s) in delta_per_sample.csv are not in GENE_ORDER and "
        f"will be excluded from the analysis: {unlisted}. Add them to GENE_ORDER to "
        f"include them.",
        stacklevel=2,
    )
missing_from_data = [g for g in GENE_ORDER if g not in genes_in_data]
if missing_from_data:
    warnings.warn(
        f"GENE_ORDER lists gene(s) with no rows in the data: {missing_from_data}.",
        stacklevel=2,
    )

GENES = [g for g in GENE_ORDER if g in genes_in_data]
delta_df = delta_df[delta_df["product"].isin(GENES)].copy()

delta_df.head()
```
```{python}
#| label: preview-gene-key
gene_key[["product", "mean_delta"]].set_index("product").round(4)
```
## Per-Gene Statistics
Each gene's per-sample Δ(πN−πS) values are tested against the pooled Δ values of all
other genes with a Kruskal–Wallis test; the p-values are then corrected across genes
with Benjamini–Hochberg (`scipy.stats.false_discovery_control`).
```{python}
#| label: gene-statistics
def gene_vs_rest_fdr(frame, genes, label=""):
    """Kruskal–Wallis of each gene's delta values vs. all other genes, BH-corrected.

    Returns a DataFrame with one row per gene: gene, n, kruskal_H, p_value, bh_fdr.
    Genes with fewer than two observations (or with no variation at all) get NaN
    statistics and are excluded from the correction rather than silently passed.
    """
    recs = []
    for gene in genes:
        in_gene = frame.loc[frame["product"] == gene, DELTA_COLUMN].dropna().to_numpy()
        rest    = frame.loc[frame["product"] != gene, DELTA_COLUMN].dropna().to_numpy()
        stat, pval = np.nan, np.nan
        if len(in_gene) >= 2 and len(rest) >= 2:
            try:
                stat, pval = kruskal(in_gene, rest)
            except ValueError:
                # All values identical — Kruskal–Wallis is undefined.
                stat, pval = np.nan, np.nan
        recs.append({"gene": gene, "n": len(in_gene),
                     "kruskal_H": stat, "p_value": pval})

    out = pd.DataFrame(recs)
    out["bh_fdr"] = np.nan
    testable = out["p_value"].notna()
    if testable.any():
        out.loc[testable, "bh_fdr"] = false_discovery_control(
            out.loc[testable, "p_value"].to_numpy(), method="bh"
        )
    if (~testable).any():
        print(f"  {label}not testable (n < 2 or no variation): "
              f"{out.loc[~testable, 'gene'].tolist()}")
    return out


pooled_stats = gene_vs_rest_fdr(delta_df, GENES, label="pooled — ")
print(f"Pooled tests: {int(pooled_stats['p_value'].notna().sum())} genes tested, "
      f"{int((pooled_stats['bh_fdr'] < FDR_ALPHA).sum())} with BH FDR < {FDR_ALPHA}")
pooled_stats.round(6)
```
## Panel 1 — Mean Δ(πN−πS) per Gene (Pooled)
```{python}
#| label: panel1-calc
summary_rows = []
for gene in GENES:
    vals = delta_df.loc[delta_df["product"] == gene, DELTA_COLUMN]
    summary_rows.append({
        "gene":       gene,
        "mean_delta": vals.mean(),
        "sem":        vals.sem(),
        "n":          len(vals),
    })

pooled_df = pd.DataFrame(summary_rows)
pooled_df = pooled_df.merge(
    pooled_stats[["gene", "kruskal_H", "p_value", "bh_fdr"]],
    on="gene", how="left", validate="one_to_one",
)

# Untestable genes are drawn as non-significant rather than dropped.
pooled_df["bh_fdr"] = pooled_df["bh_fdr"].fillna(1.0).clip(lower=0.0, upper=1.0)
pooled_df
```
```{python}
#| label: panel1-plot
#| fig-width: 7
#| fig-height: 4
# ── Colour mapping: viridis for sig, grey for non-sig ─────────────────────
cmap     = plt.cm.viridis
fdr_vals = pooled_df.loc[pooled_df["bh_fdr"] < FDR_ALPHA, "bh_fdr"]
vmin     = fdr_vals.min() if len(fdr_vals) > 0 else 0.001
vmax     = FDR_ALPHA

def bar_color(fdr, lo=None):
    """Viridis for FDR below alpha, flat grey above it."""
    lo = vmin if lo is None else lo
    if fdr < FDR_ALPHA:
        span = max(vmax - lo, 1e-12)
        return cmap(np.clip((fdr - lo) / span, 0.0, 1.0))
    return "#aaaaaa"

def star_label(fdr):
    """Stars driven by FDR_STAR_THRESH, ascending: *** / ** / *."""
    for n_stars, thresh in enumerate(sorted(FDR_STAR_THRESH), start=1):
        if fdr < thresh:
            return "*" * (len(FDR_STAR_THRESH) - n_stars + 1)
    return ""

colors = [bar_color(f) for f in pooled_df["bh_fdr"]]
stars  = [star_label(f) for f in pooled_df["bh_fdr"]]

fig, ax = plt.subplots(figsize=(7, 4))
x       = np.arange(len(pooled_df))

ax.bar(x, pooled_df["mean_delta"], yerr=pooled_df["sem"],
       color=colors, edgecolor="black", linewidth=0.5,
       capsize=3, error_kw={"linewidth": 0.8})

# ── Significance stars ────────────────────────────────────────────────────
for xi, (val, sem_val, star) in enumerate(zip(
    pooled_df["mean_delta"], pooled_df["sem"], stars
)):
    if star:
        sign = 1 if val >= 0 else -1
        offset = sem_val + np.ptp(pooled_df["mean_delta"]) * 0.04
        ax.text(xi, val + sign * offset, star, ha="center", va="center",
                fontsize=10, fontweight="bold")

# ── Decor ─────────────────────────────────────────────────────────────────
ax.axhline(0, color="black", linewidth=0.8)
ax.set_xticks(x)
ax.set_xticklabels(pooled_df["gene"], rotation=30, ha="right")
ax.set_ylabel("Δ(πN − πS)")
ax.set_title("Selection Pressure per Gene (pooled DPIs)", fontweight="bold")

# ── Colour bar ────────────────────────────────────────────────────────────
sm = plt.cm.ScalarMappable(cmap=cmap, norm=plt.Normalize(vmin=vmin, vmax=vmax))
sm.set_array([])
cbar = fig.colorbar(sm, ax=ax, shrink=0.65, aspect=20, pad=0.02)
cbar.set_label("Kruskal–Wallis BH FDR", fontsize=7)
cbar.ax.tick_params(labelsize=6)

fig.tight_layout()

png_path = os.path.join(OUTPUT_DIR, "selection_pressure_bar.png")
svg_path = os.path.join(OUTPUT_DIR, "selection_pressure_bar.svg")
fig.savefig(png_path, dpi=DPI_EXPORT, bbox_inches="tight")
fig.savefig(svg_path, format="svg", bbox_inches="tight")
plt.show()

print(f"Saved: {png_path}")
print(f"Saved: {svg_path}")
```
## Panel 2 — Stacked DPI Subplots (dpi3 · dpi5)
Each timepoint gets its **own** Kruskal–Wallis tests and its own Benjamini–Hochberg
correction across genes — the pooled result from Panel 1 is not reused here, so the
two subplots can and do carry different stars.
```{python}
#| label: panel2-calc
dpi_df = delta_df[delta_df["dpi"].isin(DPI_PANEL_LABELS)].copy()

available_dpis = [d for d in DPI_PANEL_LABELS if (dpi_df["dpi"] == d).any()]
missing_dpis = [d for d in DPI_PANEL_LABELS if d not in available_dpis]
if missing_dpis:
    warnings.warn(f"DPI_PANEL_LABELS entries with no rows in the data: {missing_dpis}",
                  stacklevel=2)

dpi_summary = []
dpi_stat_frames = []
for dpi in available_dpis:
    sub = dpi_df[dpi_df["dpi"] == dpi]
    stats_dpi = gene_vs_rest_fdr(sub, GENES, label=f"{dpi} — ")
    stats_dpi.insert(0, "dpi", dpi)
    dpi_stat_frames.append(stats_dpi)

    for gene in GENES:
        vals = sub.loc[sub["product"] == gene, DELTA_COLUMN]
        if len(vals) > 0:
            dpi_summary.append({
                "dpi":        dpi,
                "gene":       gene,
                "mean_delta": vals.mean(),
                "sem":        vals.sem(),
                "n":          len(vals),
            })

dpi_stats = pd.concat(dpi_stat_frames, ignore_index=True)
dpi_pooled = pd.DataFrame(dpi_summary).merge(
    dpi_stats[["dpi", "gene", "kruskal_H", "p_value", "bh_fdr"]],
    on=["dpi", "gene"], how="left", validate="one_to_one",
)
dpi_pooled["bh_fdr"] = dpi_pooled["bh_fdr"].fillna(1.0).clip(lower=0.0, upper=1.0)
dpi_pooled.round(6)
```
```{python}
#| label: panel2-plot
#| fig-width: 10
#| fig-height: 4.5
n_dpis = len(available_dpis)
fig, axes = plt.subplots(1, max(n_dpis, 1), figsize=(10, 4.5), sharey=True, squeeze=False)
axes = axes.ravel()

for ax, dpi_label in zip(axes, available_dpis):
    sub = dpi_pooled[dpi_pooled["dpi"] == dpi_label].copy()
    sub = sub.set_index("gene").reindex(GENES).reset_index()
    sub["bh_fdr"] = sub["bh_fdr"].fillna(1.0)

    # Rescale the colour ramp to this timepoint's own FDR range.
    sub_fdr_vals = sub.loc[sub["bh_fdr"] < FDR_ALPHA, "bh_fdr"]
    sub_vmin     = sub_fdr_vals.min() if len(sub_fdr_vals) > 0 else 0.001

    sub_colors = [bar_color(f, lo=sub_vmin) for f in sub["bh_fdr"]]
    sub_stars  = [star_label(f) for f in sub["bh_fdr"]]

    x = np.arange(len(sub))
    ax.bar(x, sub["mean_delta"], yerr=sub["sem"],
           color=sub_colors, edgecolor="black", linewidth=0.5,
           capsize=3, error_kw={"linewidth": 0.8})

    for xi, (val, sem_val, star) in enumerate(zip(
        sub["mean_delta"], sub["sem"], sub_stars
    )):
        if star:
            sign   = 1 if val >= 0 else -1
            offset = sem_val + np.ptp(pooled_df["mean_delta"]) * 0.05
            ax.text(xi, val + sign * offset, star, ha="center", va="center",
                    fontsize=10, fontweight="bold")

    ax.axhline(0, color="black", linewidth=0.8)
    ax.set_xticks(x)
    ax.set_xticklabels(sub["gene"].fillna(""), rotation=30, ha="right")
    ax.set_title(f"{dpi_label.upper()} (BH within timepoint)", fontweight="bold")
    ax.set_ylabel("Δ(πN − πS)")

fig.tight_layout()

png_path = os.path.join(OUTPUT_DIR, "selection_pressure_stacked_dpi.png")
svg_path = os.path.join(OUTPUT_DIR, "selection_pressure_stacked_dpi.svg")
fig.savefig(png_path, dpi=DPI_EXPORT, bbox_inches="tight")
fig.savefig(svg_path, format="svg", bbox_inches="tight")
plt.show()

print(f"Saved: {png_path}")
print(f"Saved: {svg_path}")
```
## Summary Table
```{python}
#| label: summary-table
summary_out = pooled_df[
    ["gene", "n", "mean_delta", "sem", "kruskal_H", "p_value", "bh_fdr"]
].copy()
summary_out["significance"] = [star_label(f) for f in summary_out["bh_fdr"]]
summary_out = summary_out.round(6)

csv_path = os.path.join(OUTPUT_DIR, "selection_pressure_summary.csv")
summary_out.to_csv(csv_path, index=False)
print(f"Saved: {csv_path}")
summary_out
```