is_nonempty_path <- function(x) {
  !is.null(x) && length(x) == 1 && nzchar(x)
}

sanitize_filename <- function(x) {
  gsub("[^A-Za-z0-9_-]+", "_", x)
}

plot_file_stub <- function(name) {
  paste(PLOT_PREFIX, sanitize_filename(name), sep = "_")
}

save_plot_multi <- function(plot_obj, filename, width, height) {
  for (fmt in OUTPUT_FORMATS) {
    target <- file.path(OUTPUT_DIR, paste0(filename, ".", fmt))
    if (fmt == "svg") {
      ggsave(target, plot = plot_obj, width = width, height = height, device = "svg")
    } else if (fmt == "tiff") {
      ggsave(target, plot = plot_obj, width = width, height = height, dpi = 300, compression = "lzw")
    } else {
      ggsave(target, plot = plot_obj, width = width, height = height)
    }
  }
}

save_pheatmap_multi <- function(pheatmap_obj, filename, width, height) {
  for (fmt in OUTPUT_FORMATS) {
    target <- file.path(OUTPUT_DIR, paste0(filename, ".", fmt))
    if (fmt == "svg") {
      svglite::svglite(target, width = width, height = height)
    } else if (fmt == "tiff") {
      tiff(target, width = width, height = height, units = "in", res = 300, compression = "lzw")
    } else {
      png(target, width = width, height = height, units = "in", res = 300)
    }
    grid::grid.newpage()
    grid::grid.draw(pheatmap_obj$gtable)
    dev.off()
  }
}

read_tabular_file <- function(path, sheet = 1) {
  ext <- tolower(tools::file_ext(path))
  if (ext == "csv") {
    readr::read_csv(path, show_col_types = FALSE)
  } else if (ext %in% c("tsv", "txt")) {
    readr::read_tsv(path, show_col_types = FALSE)
  } else if (ext %in% c("xlsx", "xls")) {
    readxl::read_excel(path, sheet = sheet)
  } else {
    stop("Unsupported tabular input: ", path)
  }
}

coerce_count_matrix <- function(path, sheet = 1) {
  tbl <- as.data.frame(read_tabular_file(path, sheet = sheet))
  if (ncol(tbl) < 2) {
    stop("Count table must contain one feature column plus at least one sample column: ", path)
  }

  feature_ids <- as.character(tbl[[1]])
  if (anyNA(feature_ids) || any(feature_ids == "")) {
    stop("The first column of ", path, " contains missing feature IDs.")
  }
  if (anyDuplicated(feature_ids)) {
    dup_ids <- unique(feature_ids[duplicated(feature_ids)])
    stop("Duplicated feature IDs in ", path, ": ", paste(head(dup_ids, 10), collapse = ", "))
  }

  value_tbl <- tbl[-1]
  value_tbl[] <- lapply(value_tbl, function(x) suppressWarnings(as.numeric(as.character(x))))
  if (anyNA(as.matrix(value_tbl))) {
    stop("Non-numeric counts detected in ", path, ".")
  }

  mat <- as.matrix(value_tbl)
  rownames(mat) <- feature_ids
  storage.mode(mat) <- "numeric"
  mat
}

resolve_assay_matrix <- function(se, assay_name = NULL, label = "SummarizedExperiment") {
  if (!inherits(se, "SummarizedExperiment")) {
    stop(label, " is not a SummarizedExperiment.")
  }

  available_assays <- SummarizedExperiment::assayNames(se)
  chosen_assay <- assay_name
  if (is.null(chosen_assay)) {
    chosen_assay <- if (length(available_assays)) available_assays[[1]] else 1
  }

  mat <- SummarizedExperiment::assay(se, chosen_assay)
  storage.mode(mat) <- "numeric"
  mat
}

coerce_design_formula <- function(x) {
  if (inherits(x, "formula")) {
    x
  } else if (is.character(x) && length(x) == 1) {
    stats::as.formula(x)
  } else {
    stop("DESIGN_FORMULA must be a formula or a length-1 character string.")
  }
}

align_metadata_to_samples <- function(metadata, sample_names, candidate_columns) {
  hits <- character(0)

  for (col in candidate_columns[candidate_columns %in% names(metadata)]) {
    values <- as.character(metadata[[col]])
    if (!anyDuplicated(values) && setequal(values, sample_names)) {
      hits <- c(hits, col)
    }
  }

  if (length(hits) == 0) {
    row_id <- rownames(metadata)
    if (!is.null(row_id) && !anyDuplicated(row_id) && setequal(row_id, sample_names)) {
      ordered <- metadata[match(sample_names, row_id), , drop = FALSE]
      ordered$matched_sample_id <- sample_names
      return(list(metadata = ordered, sample_column = ".rownames"))
    }

    stop(
      "Could not align metadata to samples. Tried columns: ",
      paste(candidate_columns, collapse = ", "),
      ". Metadata columns: ",
      paste(names(metadata), collapse = ", "),
      ". Sample names: ",
      paste(head(sample_names, 8), collapse = ", ")
    )
  }

  chosen <- hits[[1]]
  ordered <- metadata[match(sample_names, metadata[[chosen]]), , drop = FALSE]
  ordered$matched_sample_id <- sample_names
  list(metadata = ordered, sample_column = chosen)
}

apply_reference_levels <- function(metadata, reference_levels) {
  for (col in names(reference_levels)) {
    if (!col %in% names(metadata)) {
      stop("REFERENCE_LEVELS refers to missing metadata column: ", col)
    }
    metadata[[col]] <- factor(metadata[[col]])
    if (!reference_levels[[col]] %in% levels(metadata[[col]])) {
      stop("Reference level '", reference_levels[[col]], "' is not present in metadata column '", col, "'.")
    }
    metadata[[col]] <- stats::relevel(metadata[[col]], ref = reference_levels[[col]])
  }
  metadata
}

validate_optional_modules <- function(optional_modules) {
  required_names <- c(
    "library_diagnostic",
    "split_models",
    "viral_features",
    "ma_plots",
    "sample_distance_heatmap",
    "top_heatmaps",
    "analysis_bundle"
  )
  missing_names <- setdiff(required_names, names(optional_modules))
  if (length(missing_names) > 0) {
    stop("OPTIONAL_MODULES is missing: ", paste(missing_names, collapse = ", "))
  }
}

validate_contrasts <- function(contrast_table, split_enabled) {
  required_cols <- c("model_id", "contrast_name", "factor", "numerator", "denominator")
  missing_cols <- setdiff(required_cols, names(contrast_table))
  if (length(missing_cols) > 0) {
    stop("CONTRASTS is missing required columns: ", paste(missing_cols, collapse = ", "))
  }

  if (!split_enabled) {
    contrast_table$model_id <- "all"
  }

  if (anyDuplicated(paste(contrast_table$model_id, contrast_table$contrast_name, sep = "::"))) {
    stop("Each row in CONTRASTS must have a unique model_id + contrast_name combination.")
  }

  contrast_table
}

comparison_label_from_row <- function(model_id, contrast_name, split_enabled) {
  if (split_enabled) {
    paste(model_id, contrast_name, sep = " | ")
  } else {
    contrast_name
  }
}

extract_results_tidy <- function(result_obj, shrunk_obj, comparison_label, model_id, contrast_name) {
  as.data.frame(result_obj) %>%
    tibble::rownames_to_column("Gene") %>%
    mutate(
      log2FoldChange_shrunk = as.numeric(shrunk_obj$log2FoldChange[match(Gene, rownames(shrunk_obj))]),
      lfcSE_shrunk = as.numeric(shrunk_obj$lfcSE[match(Gene, rownames(shrunk_obj))]),
      model_id = model_id,
      contrast_name = contrast_name,
      comparison_label = comparison_label,
      padj_plot = pmax(dplyr::coalesce(padj, 1), .Machine$double.xmin),
      log_padj = -log10(padj_plot),
      significant = !is.na(padj) & padj < FDR_THRESHOLD & abs(log2FoldChange) >= LFC_THRESHOLD,
      direction = case_when(
        significant & log2FoldChange > 0 ~ "Up",
        significant & log2FoldChange < 0 ~ "Down",
        TRUE ~ "NS"
      )
    )
}

match_feature_row <- function(mat, pattern, label) {
  hits <- rownames(mat)[grepl(pattern, rownames(mat), ignore.case = TRUE)]
  if (length(hits) != 1) {
    stop(label, " matched ", length(hits), " rows: ", paste(hits, collapse = ", "))
  }
  hits
}

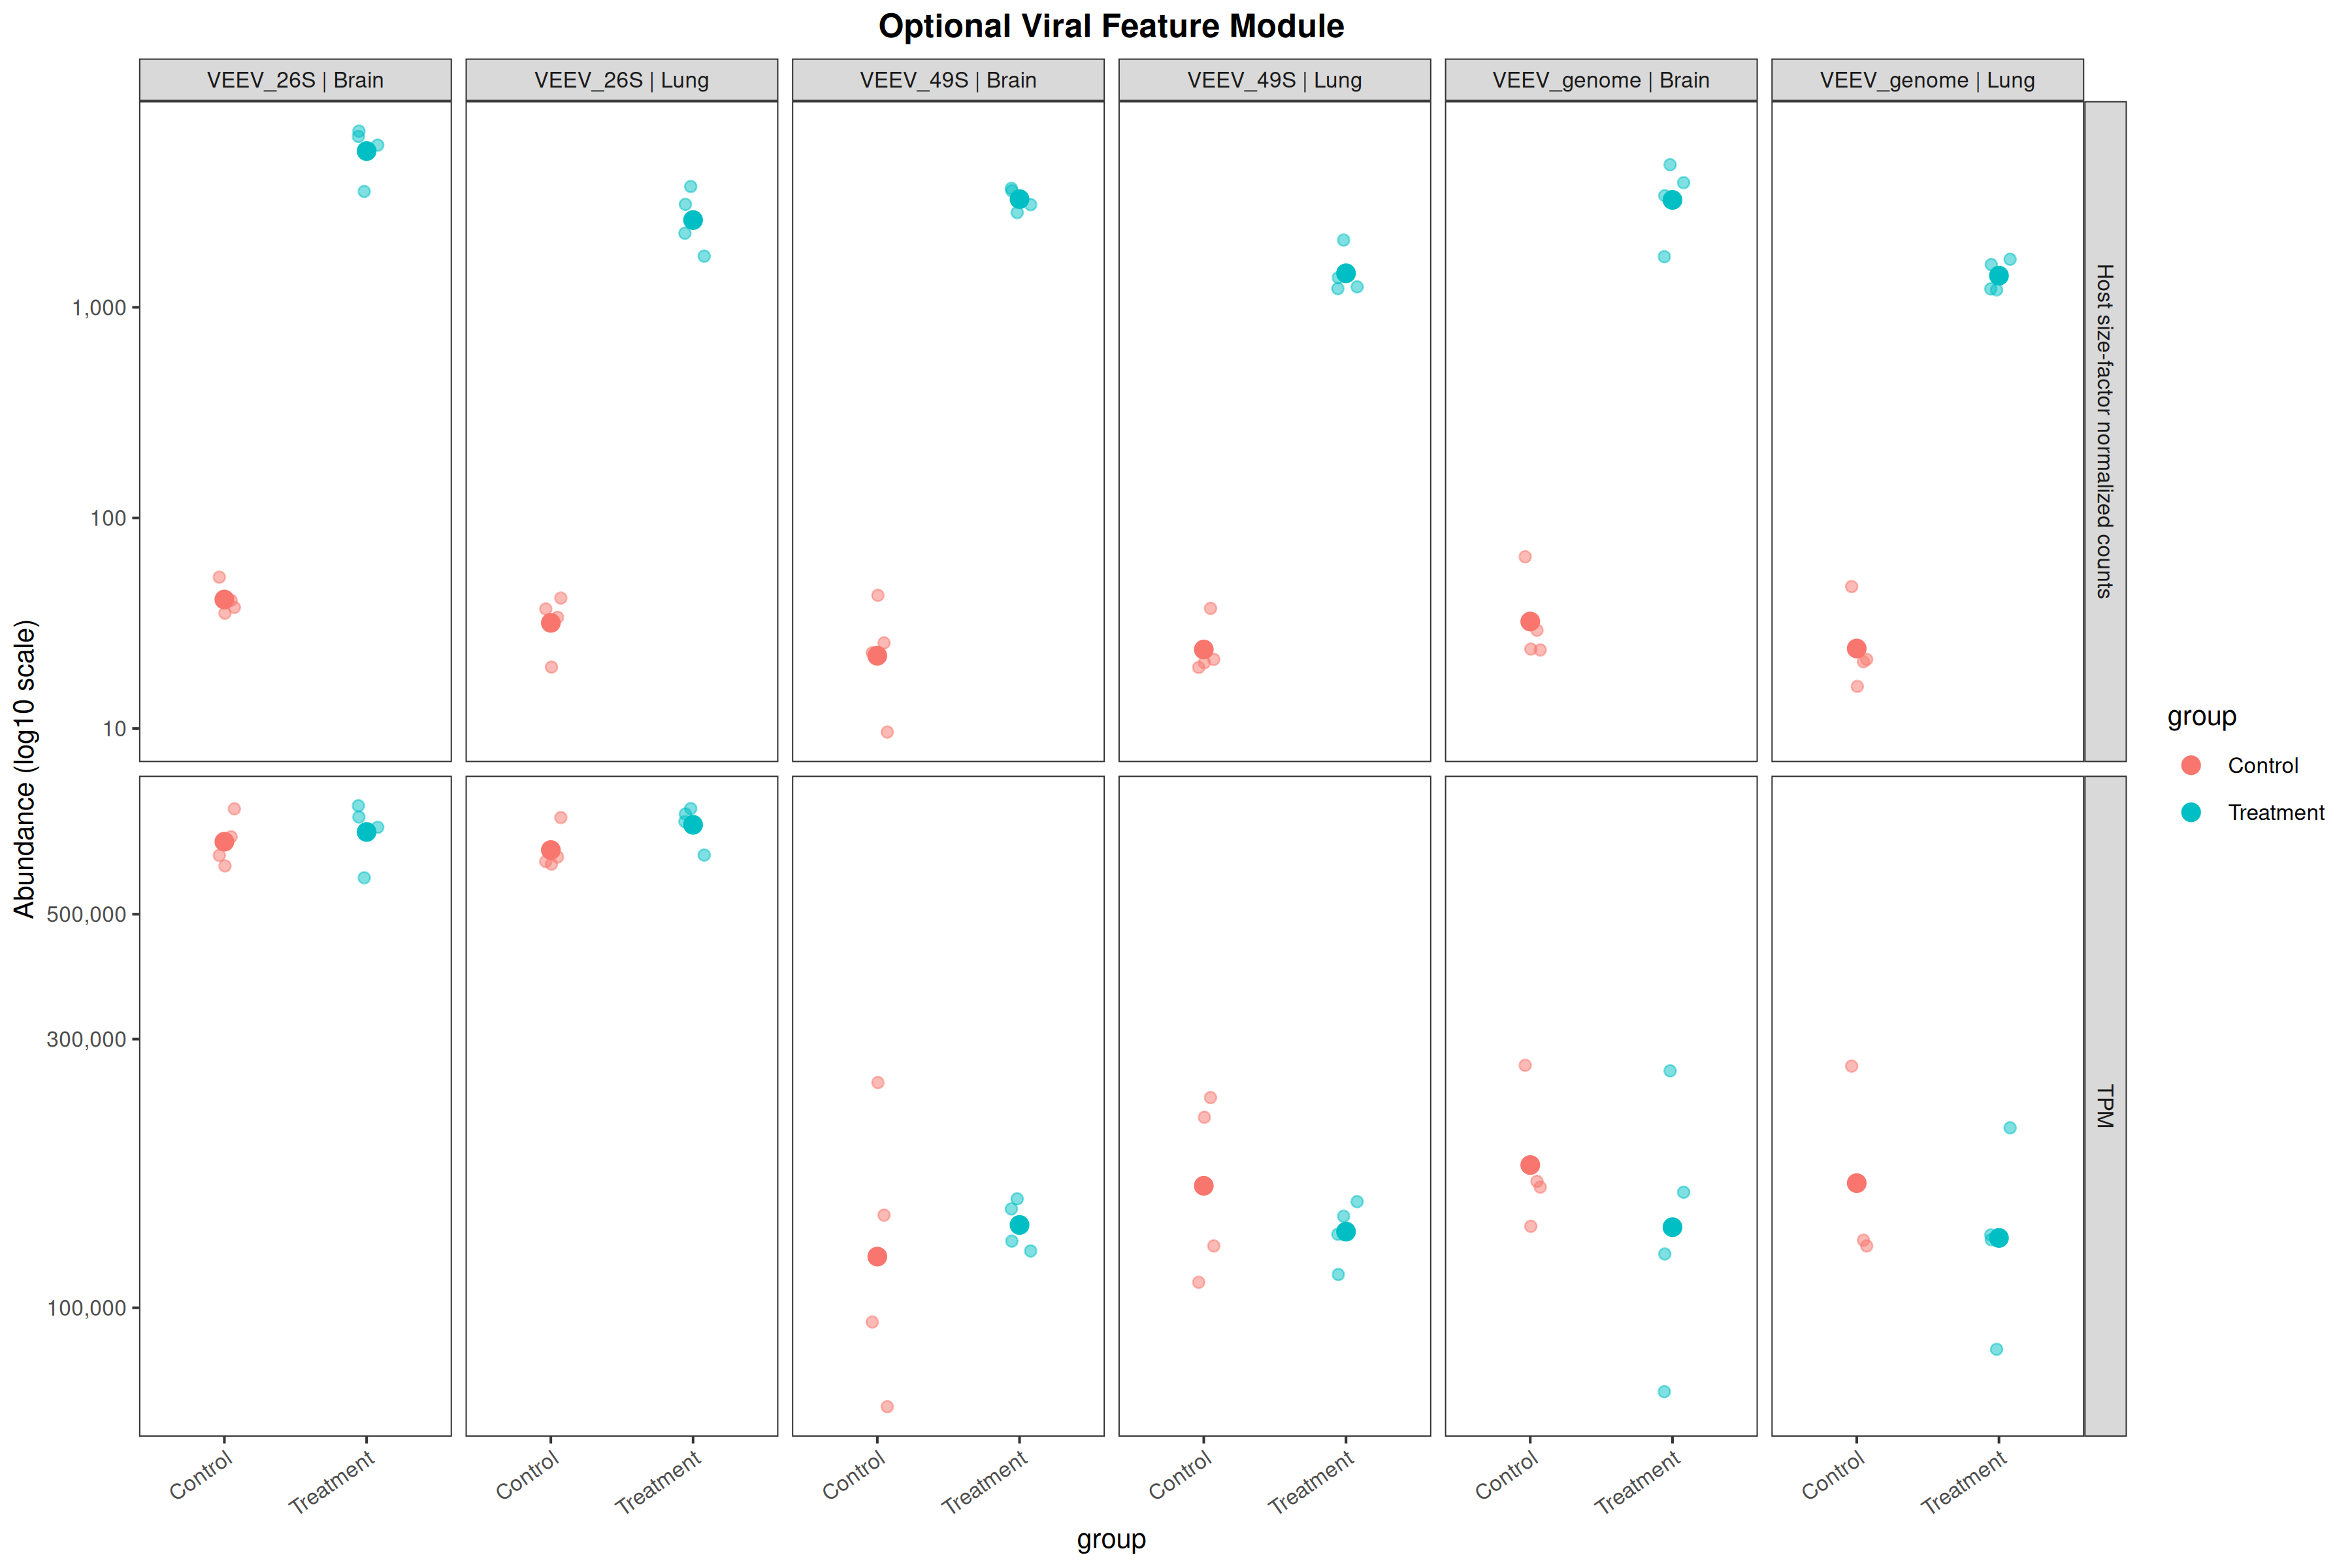
# NOTE: this template deliberately does NOT compute TPM for the viral features.
# TPM's per-sample scaling factor is a sum over the *whole* transcriptome; applied
# to a handful of viral rows it forces every sample's values to sum to 1e6, which
# erases exactly the between-group difference the panel exists to show. The gene
# count matrix carries no feature lengths, so a real transcriptome-wide TPM is not
# computable from these inputs. Instead the viral panel reports host size-factor
# normalized counts (correct for library depth, comparable across samples) and the
# same values divided by feature length (comparable across features).
normalize_by_length_kb <- function(count_matrix, lengths_bp) {
  missing_lengths <- setdiff(rownames(count_matrix), names(lengths_bp))
  if (length(missing_lengths) > 0) {
    stop("No feature length supplied for: ", paste(missing_lengths, collapse = ", "))
  }
  lengths_kb <- lengths_bp[rownames(count_matrix)] / 1000
  sweep(count_matrix, 1, lengths_kb, "/")
}

# lfcShrink stabilizes fold changes for low-count genes. apeglm cannot take an
# arbitrary `contrast`, so prefer ashr when installed and fall back to the
# built-in normal prior otherwise (no extra dependency).
shrink_log2_fold_changes <- function(dds, contrast, res) {
  shrink_type <- if (requireNamespace("ashr", quietly = TRUE)) "ashr" else "normal"
  DESeq2::lfcShrink(dds, contrast = contrast, res = res, type = shrink_type, quiet = TRUE)
}

# Excel sheet names are capped at 31 characters, so two similar comparison labels
# can truncate to the same string and silently overwrite each other.
make_unique_sheet_names <- function(labels) {
  out <- character(length(labels))
  for (i in seq_along(labels)) {
    candidate <- substr(labels[[i]], 1, 31)
    if (candidate %in% out[seq_len(i - 1)]) {
      suffix <- 2L
      repeat {
        tag <- paste0("_", suffix)
        candidate <- paste0(substr(labels[[i]], 1, 31 - nchar(tag)), tag)
        if (!candidate %in% out[seq_len(i - 1)]) break
        suffix <- suffix + 1L
      }
      warning("Excel sheet name for '", labels[[i]],
              "' collided after truncation to 31 characters; using '", candidate, "'.",
              call. = FALSE)
    }
    out[[i]] <- candidate
  }
  out
}

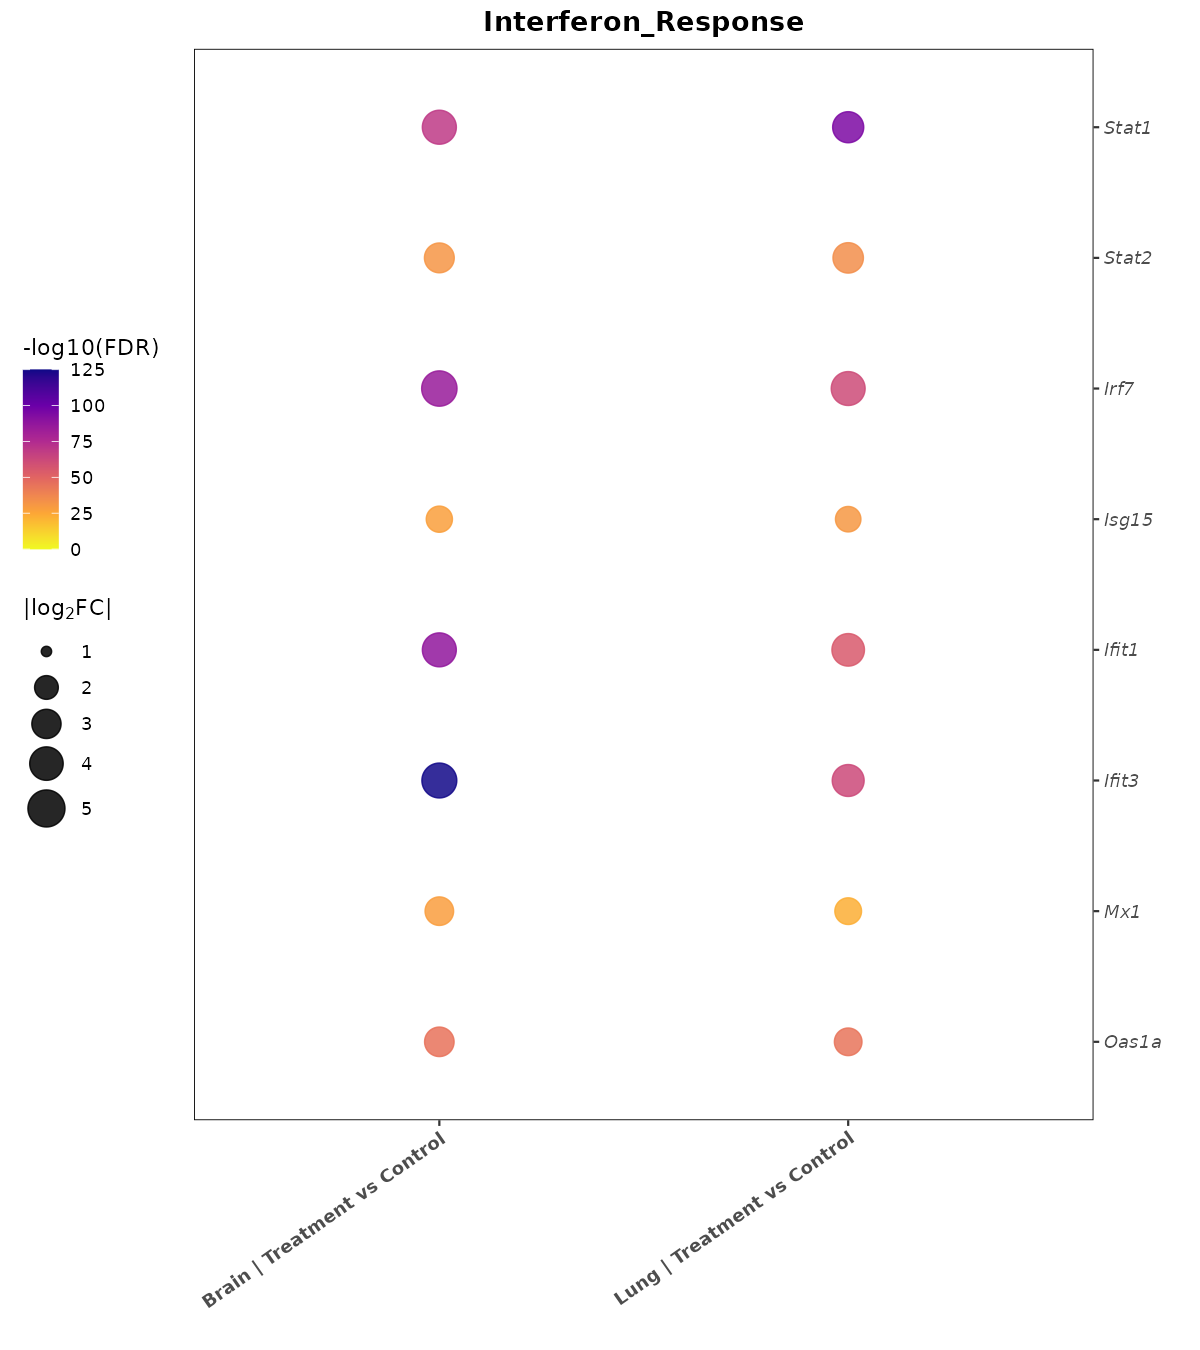
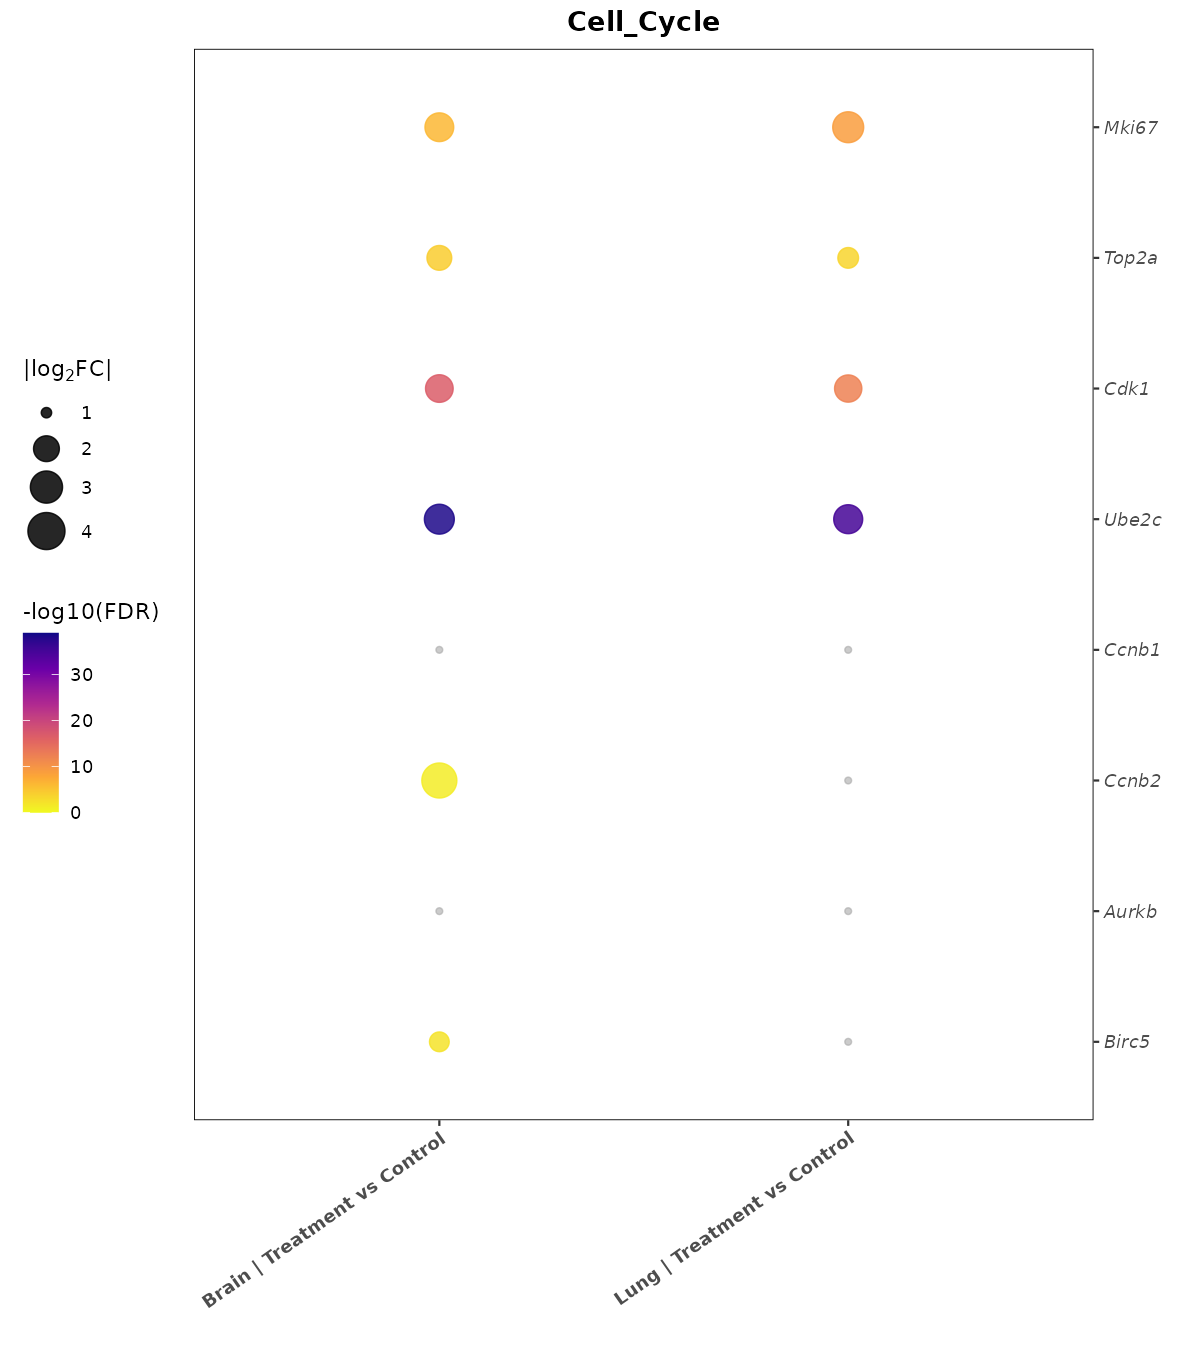
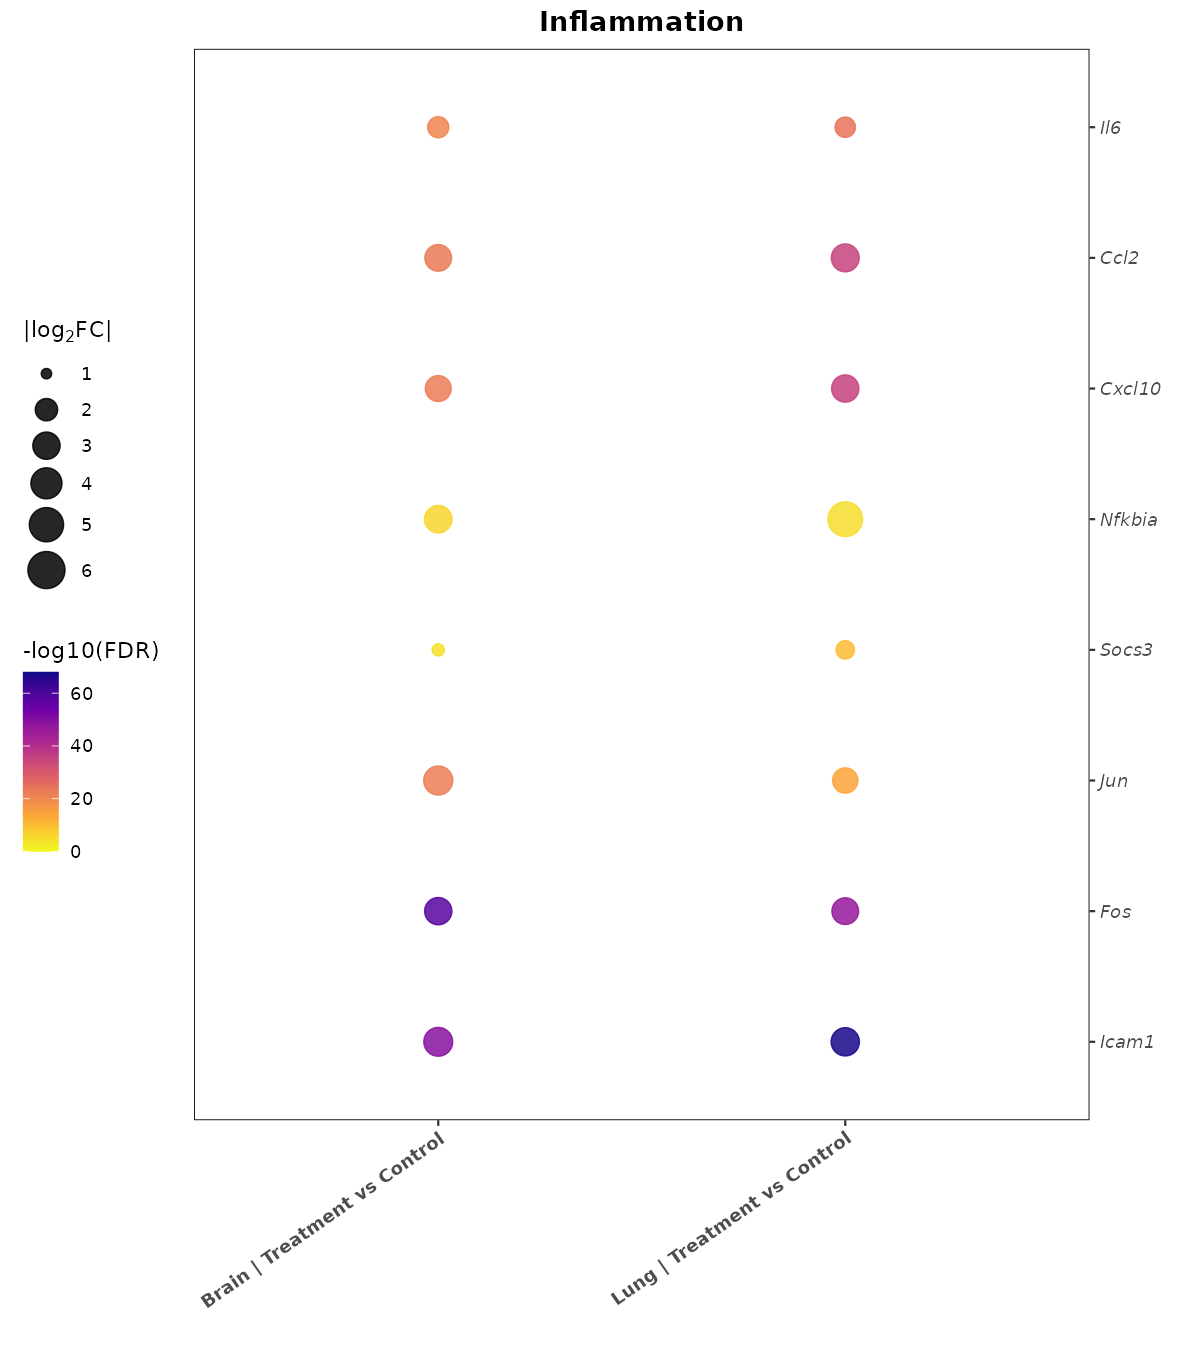
make_bubble_plot <- function(pathway_name, genes, result_data, comparison_levels) {
  plot_df <- tidyr::expand_grid(
    comparison_label = comparison_levels,
    Gene = genes
  ) %>%
    left_join(
      result_data %>%
        select(comparison_label, Gene, log2FoldChange, padj, log_padj, significant),
      by = c("comparison_label", "Gene")
    ) %>%
    mutate(
      log_padj = dplyr::coalesce(log_padj, 0),
      significant = dplyr::coalesce(significant, FALSE),
      abs_lfc = abs(dplyr::coalesce(log2FoldChange, 0)),
      color_group = ifelse(significant, "significant", "nonsignificant"),
      Gene = factor(Gene, levels = rev(genes)),
      comparison_label = factor(comparison_label, levels = comparison_levels)
    )

  ggplot() +
    geom_point(
      data = filter(plot_df, color_group == "nonsignificant"),
      aes(x = comparison_label, y = Gene),
      size = 1.2,
      color = "darkgrey",
      alpha = 0.6
    ) +
    geom_point(
      data = filter(plot_df, color_group == "significant"),
      aes(x = comparison_label, y = Gene, size = abs_lfc, color = log_padj),
      alpha = 0.85
    ) +
    scale_size_continuous(
      name = expression("|log"[2] * "FC|"),
      range = c(2, 8),
      limits = c(LFC_THRESHOLD, max(2, ceiling(max(plot_df$abs_lfc, na.rm = TRUE))))
    ) +
    scale_color_viridis_c(
      option = "plasma",
      direction = -1,
      name = "-log10(FDR)",
      limits = c(0, max(5, ceiling(max(plot_df$log_padj, na.rm = TRUE)))),
      oob = scales::squish
    ) +
    scale_y_discrete(position = "right") +
    labs(title = pathway_name, x = "", y = "") +
    theme_bw(base_size = 11, base_family = "sans") +
    theme(
      plot.title = element_text(face = "bold", hjust = 0.5),
      axis.text.x = element_text(angle = 35, hjust = 1, face = "bold"),
      axis.text.y = element_text(face = "italic"),
      legend.position = "left",
      panel.border = element_rect(colour = "black", fill = NA, linewidth = 0.4),
      panel.grid.major = element_blank(),
      panel.grid.minor = element_blank()
    )
}

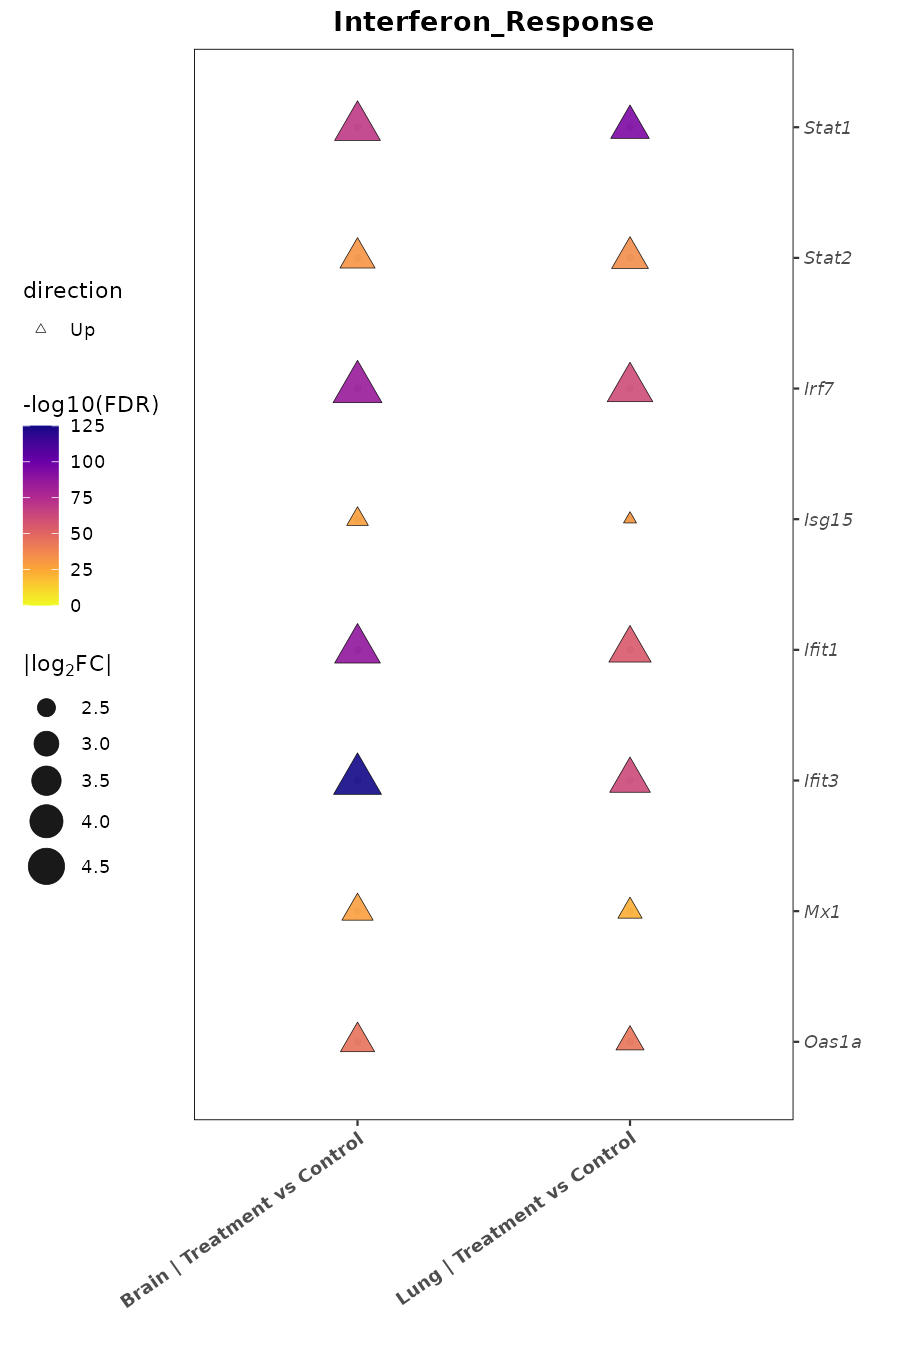
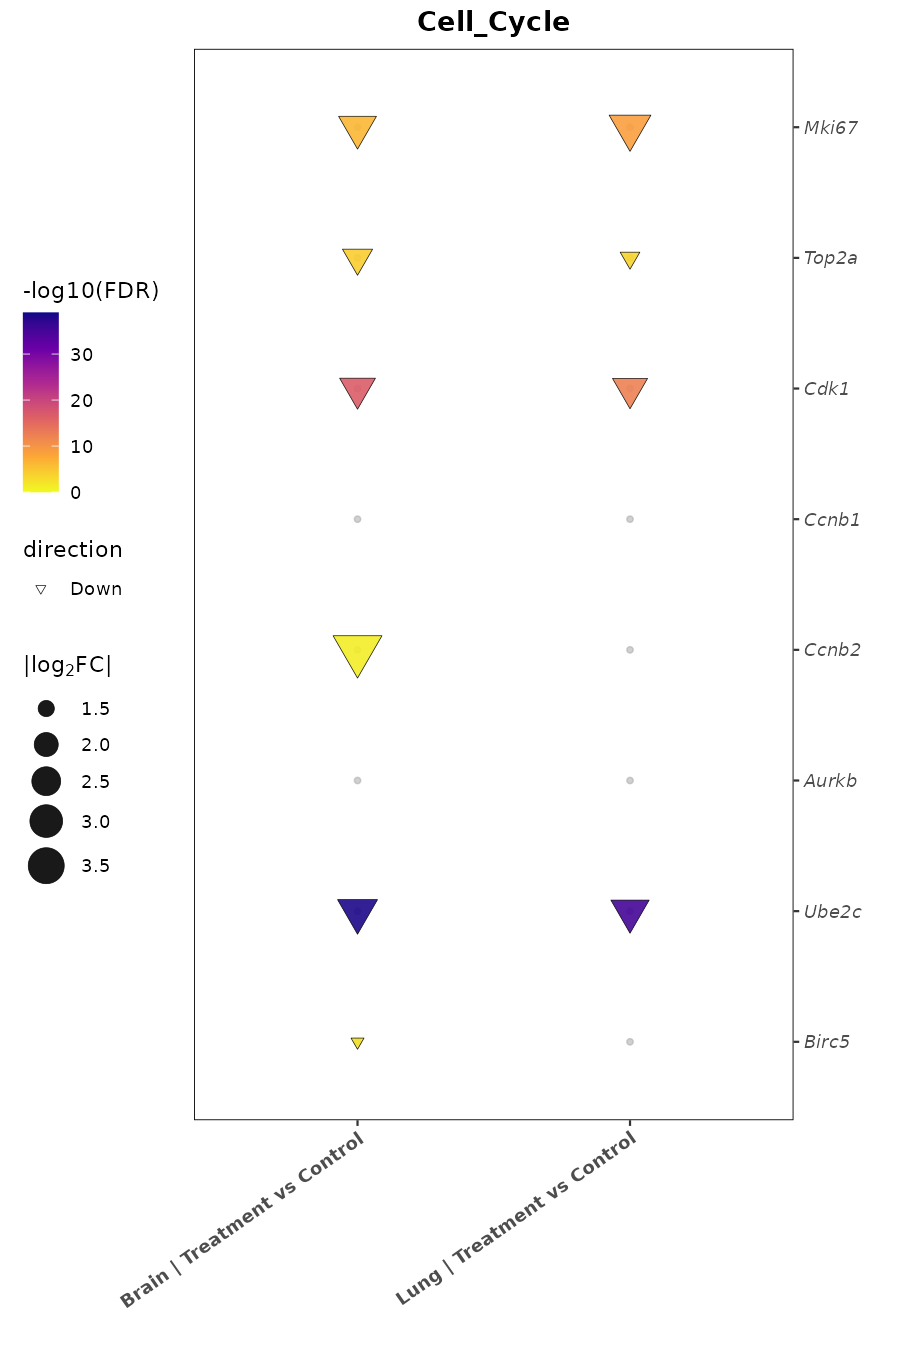
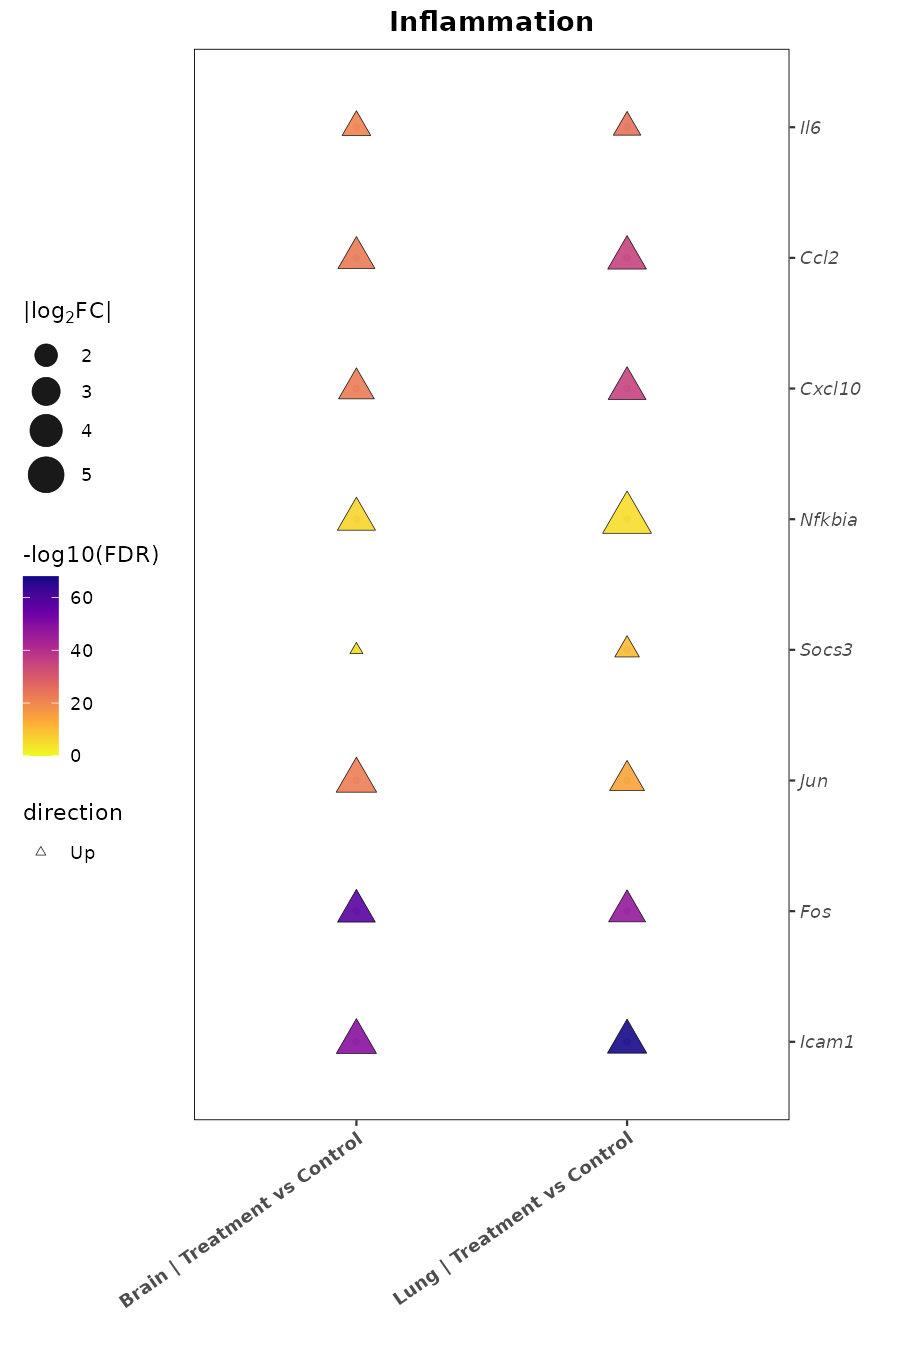
make_triangle_plot <- function(pathway_name, genes, result_data, comparison_levels) {
  base_df <- tidyr::expand_grid(
    comparison_label = comparison_levels,
    Gene = genes
  ) %>%
    mutate(
      Gene = factor(Gene, levels = rev(genes)),
      comparison_label = factor(comparison_label, levels = comparison_levels)
    )

  sig_df <- result_data %>%
    filter(comparison_label %in% comparison_levels, Gene %in% genes, significant) %>%
    mutate(
      comparison_label = factor(comparison_label, levels = comparison_levels),
      Gene = factor(Gene, levels = rev(genes))
    )

  ggplot() +
    geom_point(
      data = base_df,
      aes(x = comparison_label, y = Gene),
      size = 1.1,
      color = "darkgrey",
      alpha = 0.55
    ) +
    geom_point(
      data = sig_df,
      aes(
        x = comparison_label,
        y = Gene,
        fill = log_padj,
        size = abs(log2FoldChange),
        shape = direction
      ),
      color = "black",
      alpha = 0.9,
      stroke = 0.25
    ) +
    scale_shape_manual(values = c("Up" = 24, "Down" = 25), drop = FALSE) +
    scale_fill_viridis_c(
      option = "plasma",
      direction = -1,
      name = "-log10(FDR)",
      limits = c(0, max(5, ceiling(max(sig_df$log_padj, 0, na.rm = TRUE)))),
      oob = scales::squish
    ) +
    scale_size_continuous(name = expression("|log"[2] * "FC|"), range = c(2, 8)) +
    scale_y_discrete(position = "right") +
    labs(title = pathway_name, x = "", y = "") +
    theme_bw(base_size = 11, base_family = "sans") +
    theme(
      plot.title = element_text(face = "bold", hjust = 0.5),
      axis.text.x = element_text(angle = 35, hjust = 1, face = "bold"),
      axis.text.y = element_text(face = "italic"),
      legend.position = "left",
      panel.border = element_rect(colour = "black", fill = NA, linewidth = 0.4),
      panel.grid.major = element_blank(),
      panel.grid.minor = element_blank()
    )
}