08 · VCF Mutation Analysis

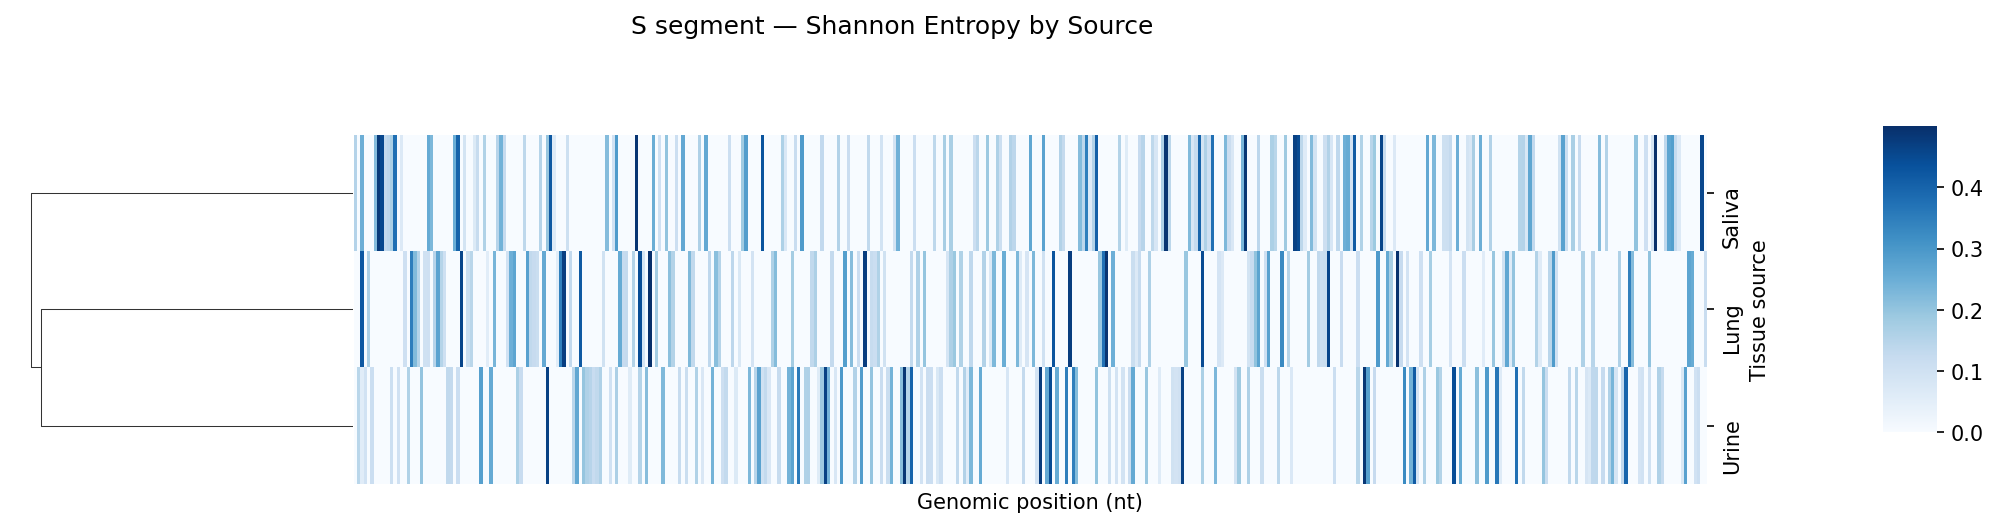
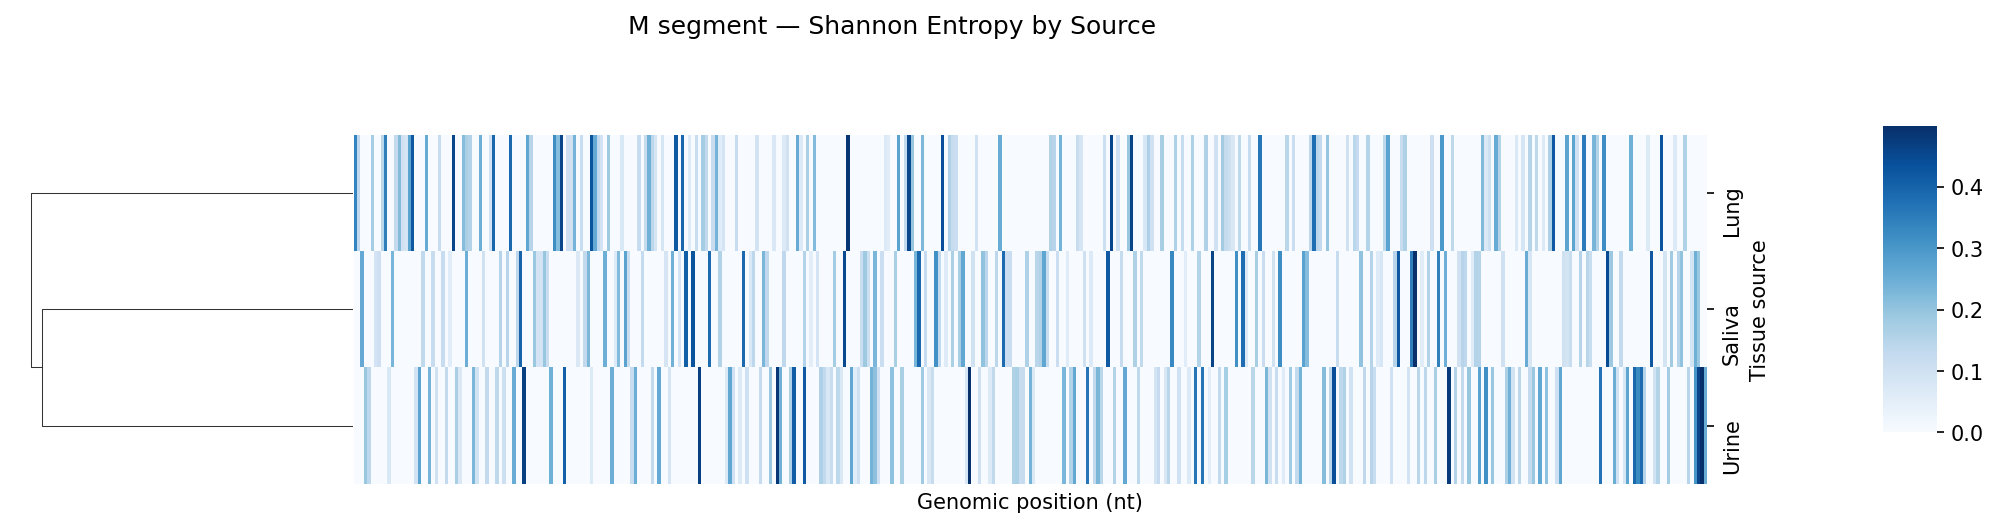
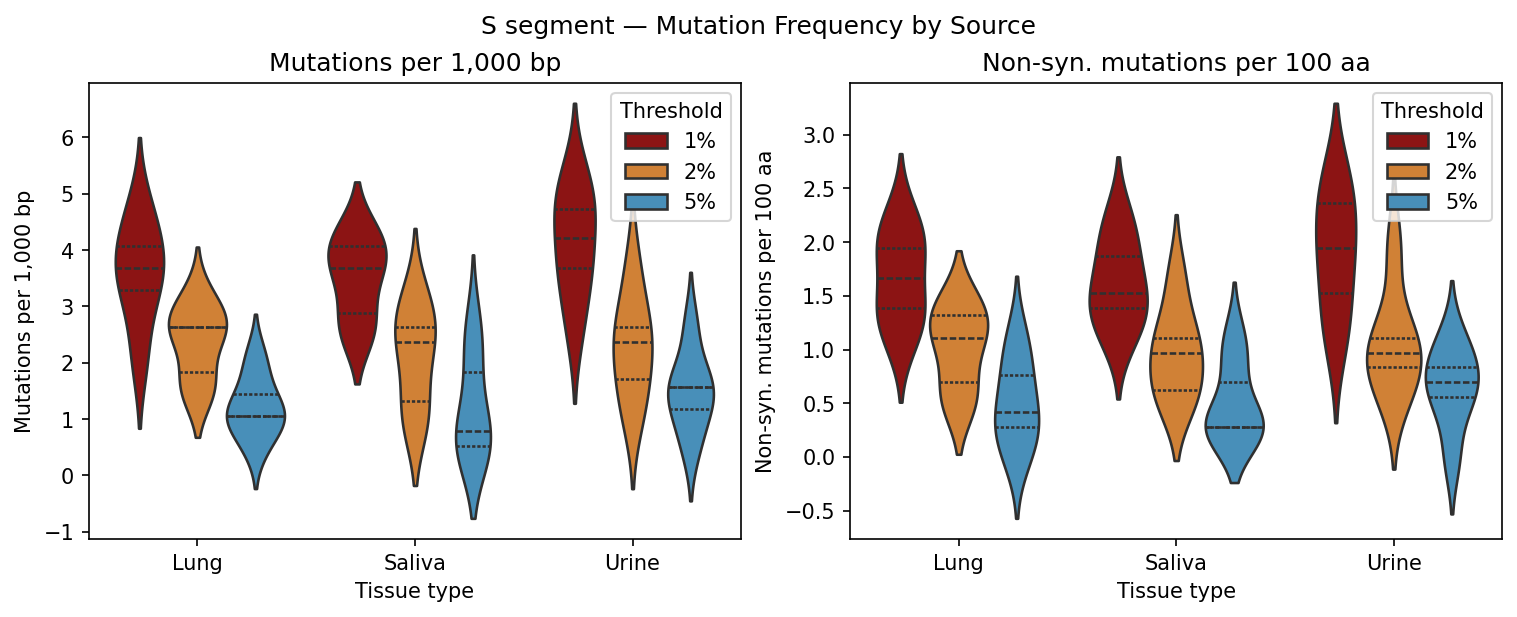
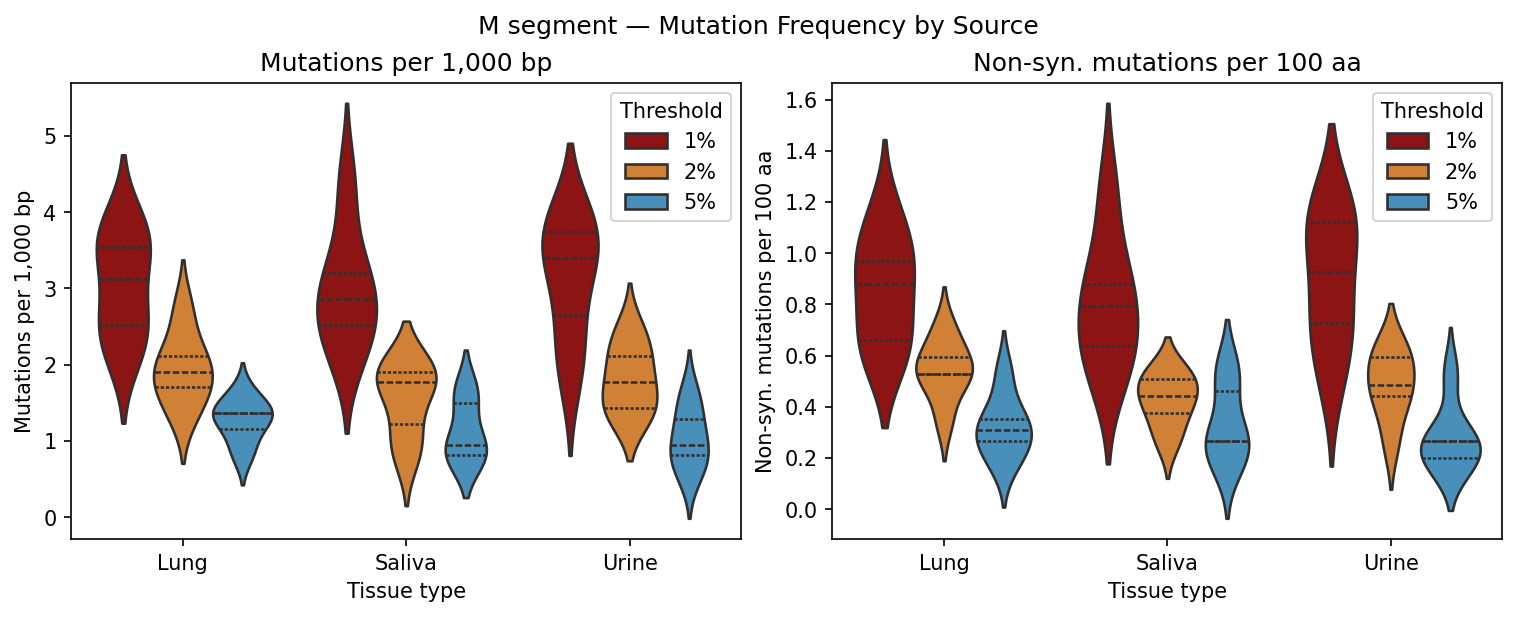
Mutation frequency, Shannon entropy heatmaps, and tissue-type comparisons

genomics
virology
VCF
mutation
entropy

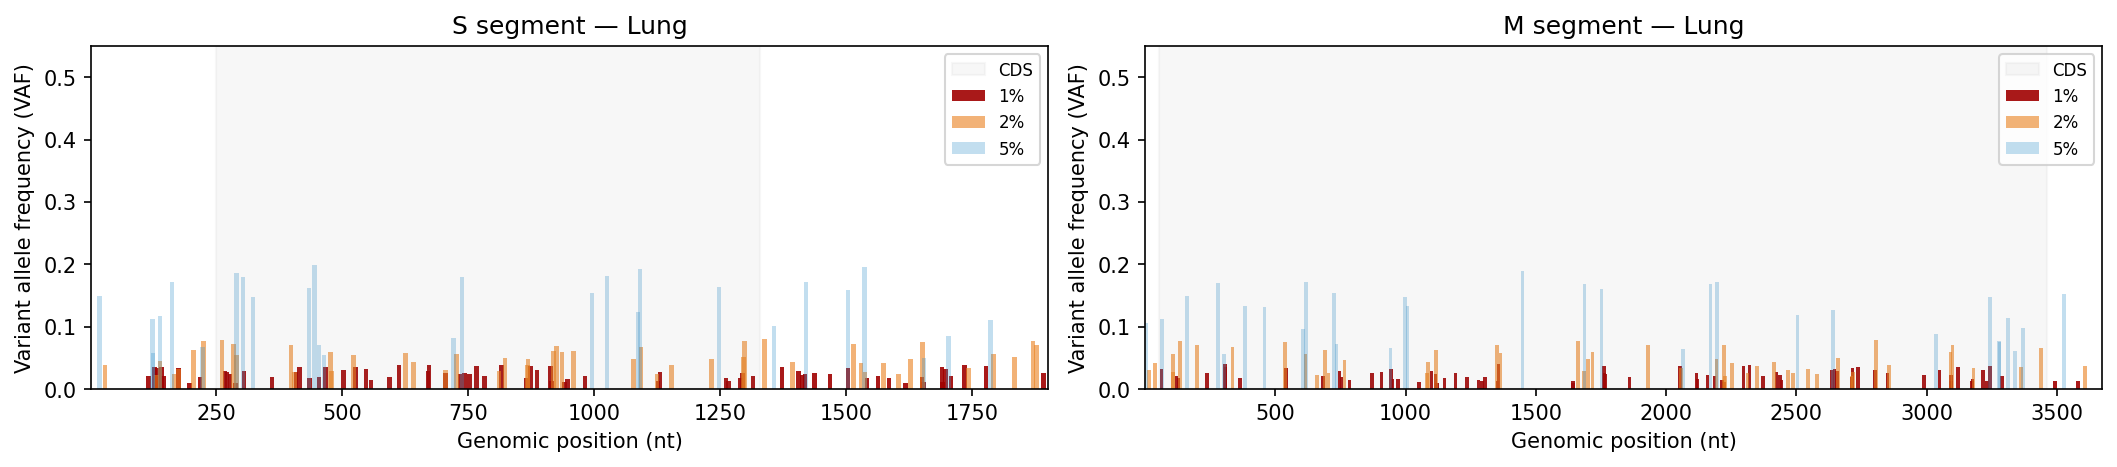
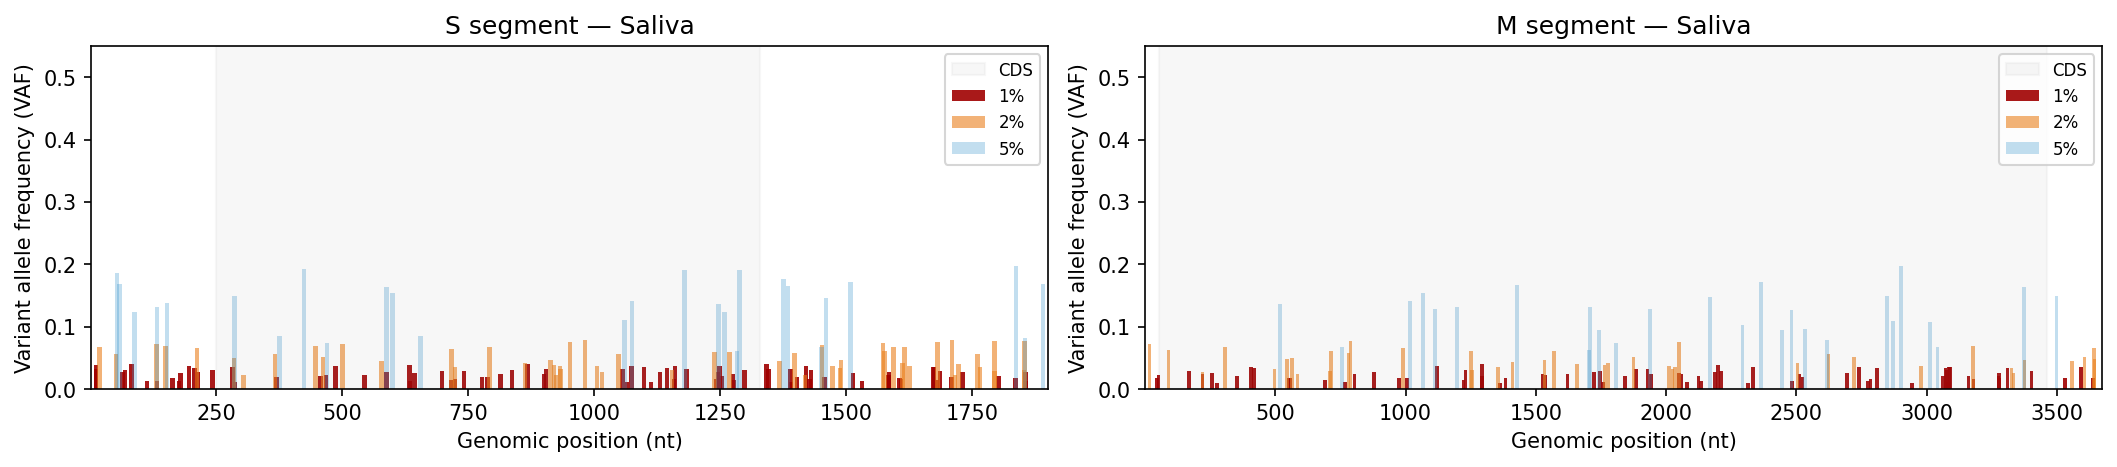
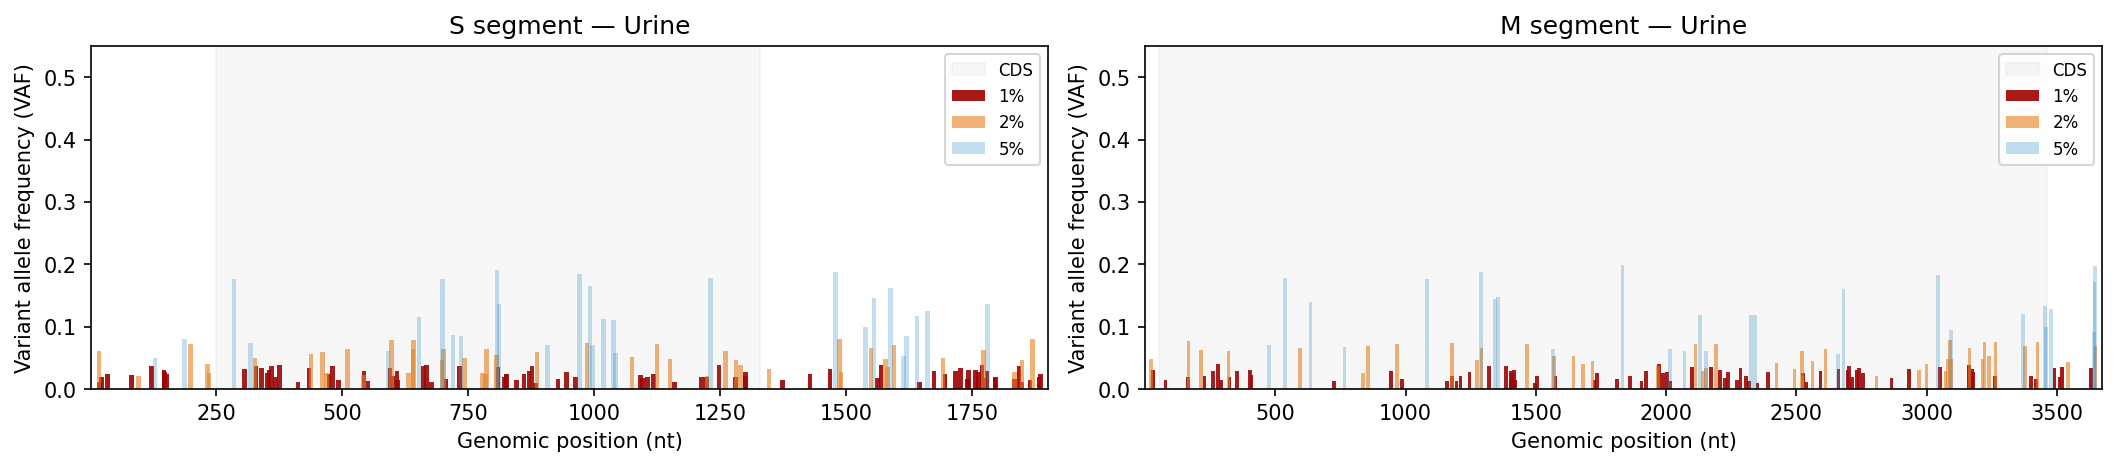
Per-sample VCF files from a variant caller. Coverage filtering, Shannon entropy per position, mutation frequency bar charts and entropy heatmaps per tissue type, Kruskal-Wallis comparison across tissue sources.

Overview

Item Details
Input Directory of .vcf files: aa_change_{ID}-{Source}_{Segment}_{Threshold}.vcf
Key packages vcfpy, pandas, scipy, seaborn, matplotlib, sklearn
Statistics Shannon entropy (natural log) · Kruskal–Wallis
Output Mutation bar charts · entropy heatmaps (SVG) · frequency tables · KW results CSV
Download template.ipynb

Edit SEGMENT_CONFIG to match your pathogen’s genome (total length, CDS boundaries, AA count). TISSUE_TYPES controls which sources are included in statistical comparisons.

← Gallery Download .ipynb


User Configuration

Code
# ── USER CONFIGURATION ────────────────────────────────────────────────────────

# Directory containing VCF files (relative to this file)
VCF_DIR = "data/aa_change_vcf"

# VCF filename format (regex). Named groups: id, source, segment, threshold
# Default: aa_change_{id}-{source}_{segment}_{threshold}.vcf
VCF_FILENAME_PATTERN = r"aa_change_(?P<id>[^-]+)-(?P<source>[^_]+)_(?P<segment>[SM])_(?P<threshold>\d+pct)\.vcf"

# Map threshold labels in filenames to display strings
THRESHOLD_LABEL_MAP = {"5pct": "5%", "2pct": "2%", "1pct": "1%"}

# Minimum read depth to retain a variant (coverage QC)
DEPTH_THRESHOLD = 500

# Tissue / source types to include in the analysis
TISSUE_TYPES = ["Lung", "Saliva", "Urine"]

# Segment geometry — edit to match your pathogen's genome
SEGMENT_CONFIG = {
    "S": {
        "length": 1902,
        "cds_start": 250,
        "cds_end": 1329,
        "aa_length": 360,
    },
    "M": {
        "length": 3675,
        "cds_start": 52,
        "cds_end": 3461,
        "aa_length": 1135,
    },
}

# VAF thresholds to display in bar charts (ordered low → high)
VAF_THRESHOLDS = ["1%", "2%", "5%"]

# Colors and transparency for each VAF threshold in bar charts
VAF_COLORS = {
    "5%": "#3594cc",
    "2%": "#ea801c",
    "1%": "#a00000",
}
VAF_ALPHA = {"5%": 0.3, "2%": 0.6, "1%": 0.9}

# Output directory for SVG plots (relative to this file)
OUTPUT_DIR = "Plots"

# ─────────────────────────────────────────────────────────────────────────────

Setup

Code
import os
import re
import warnings

import numpy as np
import pandas as pd
import vcfpy
import matplotlib.pyplot as plt
import seaborn as sns
from scipy.stats import entropy, kruskal

warnings.filterwarnings("ignore")

plt.rcParams.update({
    'axes.titlesize': 12,
    'axes.labelsize': 10,
    'xtick.labelsize': 10,
    'ytick.labelsize': 10,
    'legend.fontsize': 10,
})
pd.set_option('display.width', 1000)

os.makedirs(OUTPUT_DIR, exist_ok=True)
print(f"Output will be saved to: {os.path.abspath(OUTPUT_DIR)}")
Output will be saved to: /home/runner/work/lab-bioinfo-templates/lab-bioinfo-templates/templates/08_vcf-mutation-analysis/Plots

Load & Parse VCF Files

Code
pattern = re.compile(VCF_FILENAME_PATTERN)

records = []
vcf_files = [f for f in os.listdir(VCF_DIR) if f.endswith(".vcf")]
print(f"Found {len(vcf_files)} VCF files in {VCF_DIR}")

for fname in vcf_files:
    m = pattern.match(fname)
    if not m:
        print(f"  Skipping (name mismatch): {fname}")
        continue

    sample_id  = m.group("id")
    source     = m.group("source")
    segment    = m.group("segment")
    thresh_raw = m.group("threshold")
    threshold  = THRESHOLD_LABEL_MAP.get(thresh_raw, thresh_raw)

    fpath = os.path.join(VCF_DIR, fname)
    try:
        reader = vcfpy.Reader.from_path(fpath)
        for rec in reader:
            if not rec.ALT:
                continue
            alt_allele = rec.ALT[0].value if rec.ALT else "."
            aa_change  = rec.INFO.get("AA_CHANGE", "N/A")
            if isinstance(aa_change, list):
                aa_change = aa_change[0]

            sample_call = (
                rec.call_for_sample["SAMPLE"]
                if "SAMPLE" in rec.call_for_sample
                else rec.calls[0]
            )
            ad = sample_call.data.get("AD", [0, 0])
            dp = sample_call.data.get("DP", 0)

            records.append({
                "Position":          rec.POS,
                "Reference_Allele":  rec.REF,
                "Alternate_Allele":  alt_allele,
                "Quality":           rec.QUAL,
                "Amino_Acid_Change": aa_change,
                "Allelic_Depth_Ref": ad[0] if len(ad) > 0 else 0,
                "Allelic_Depth_Alt": ad[1] if len(ad) > 1 else 0,
                "Total_Depth":       dp,
                "Source":            source,
                "Segment":           segment,
                "Variant_Threshold": threshold,
                "ID":                sample_id,
            })
    except Exception as e:
        print(f"  Error reading {fname}: {type(e).__name__}: {e}")

combined_df = pd.DataFrame(records)
print(f"Total records parsed: {len(combined_df)}")

if combined_df.empty:
    raise RuntimeError(
        f"No VCF records were parsed from '{os.path.abspath(VCF_DIR)}'. "
        f"Check that simulate_data.py ran successfully and that files match "
        f"VCF_FILENAME_PATTERN. Files found: {vcf_files[:5]}"
    )

combined_df.head()
Found 108 VCF files in data/aa_change_vcf
Total records parsed: 881
Position Reference_Allele Alternate_Allele Quality Amino_Acid_Change Allelic_Depth_Ref Allelic_Depth_Alt Total_Depth Source Segment Variant_Threshold ID
0 304 A C 55.6 Arg412Ser 1886 43 1929 Saliva S 2% SMPL006
1 366 T C 50.7 Asn310Asp 1570 94 1664 Saliva S 2% SMPL006
2 1574 G T 54.6 N/A 1861 148 2009 Saliva S 2% SMPL006
3 1613 T G 31.1 N/A 2752 119 2871 Saliva S 2% SMPL006
4 1717 G T 42.5 N/A 839 20 859 Saliva S 2% SMPL006

Quality Control: Coverage Filtering

Code
pre_filter = len(combined_df)
combined_df = combined_df[combined_df["Total_Depth"] >= DEPTH_THRESHOLD].copy()
print(f"Retained {len(combined_df)} / {pre_filter} records (depth ≥ {DEPTH_THRESHOLD}x)")

# Fix Allelic_Depth_Ref when reported as 0
mask = combined_df["Allelic_Depth_Ref"] == 0
combined_df.loc[mask, "Allelic_Depth_Ref"] = (
    combined_df.loc[mask, "Total_Depth"] - combined_df.loc[mask, "Allelic_Depth_Alt"]
)

os.makedirs("data", exist_ok=True)
combined_df["VAF"] = combined_df["Allelic_Depth_Alt"] / combined_df["Total_Depth"]

combined_df.to_csv("data/mutation_df.csv", index=False)
print("Saved: data/mutation_df.csv")
combined_df.describe()
Retained 881 / 881 records (depth ≥ 500x)
Saved: data/mutation_df.csv
Position Quality Allelic_Depth_Ref Allelic_Depth_Alt Total_Depth VAF
count 881.000000 881.000000 881.000000 881.000000 881.000000 881.000000
mean 1422.601589 44.644722 1684.480136 90.888763 1775.368899 0.051563
std 954.085243 8.462602 681.173586 91.714621 713.368280 0.043777
min 5.000000 30.100000 424.000000 6.000000 505.000000 0.009498
25% 661.000000 37.300000 1101.000000 35.000000 1152.000000 0.023283
50% 1295.000000 44.300000 1711.000000 60.000000 1792.000000 0.034854
75% 1939.000000 51.800000 2265.000000 110.000000 2379.000000 0.064785
max 3648.000000 60.000000 2960.000000 566.000000 3000.000000 0.198986

Mutation Distribution Bar Charts

Code
bar_widths = {"S": 9.0, "M": 14.0}

for source in TISSUE_TYPES:
    src_df = combined_df[combined_df["Source"] == source]
    if src_df.empty:
        continue

    fig, axes = plt.subplots(1, 2, figsize=(14, 3), constrained_layout=True)

    for ax, seg in zip(axes, ["S", "M"]):
        cfg   = SEGMENT_CONFIG[seg]
        seg_df = src_df[src_df["Segment"] == seg]

        for thresh in VAF_THRESHOLDS:
            t_df = seg_df[seg_df["Variant_Threshold"] == thresh]
            if t_df.empty:
                continue
            ax.bar(
                t_df["Position"],
                t_df["VAF"],
                width=bar_widths[seg],
                color=VAF_COLORS[thresh],
                alpha=VAF_ALPHA[thresh],
                label=thresh,
            )

        ax.set_xlim(1, cfg["length"])
        ax.set_ylim(0, 0.55)
        ax.set_xlabel("Genomic position (nt)")
        ax.set_ylabel("Variant allele frequency (VAF)")
        ax.set_title(f"{seg} segment — {source}")
        ax.axvspan(cfg["cds_start"], cfg["cds_end"], alpha=0.06, color="grey", label="CDS")
        ax.legend(loc="upper right", fontsize=8)

    fig.savefig(os.path.join(OUTPUT_DIR, f"mutation_map_{source}.svg"),
                format="svg", bbox_inches="tight")
    plt.show()
    print(f"Saved: mutation_map_{source}.svg")

Saved: mutation_map_Lung.svg

Saved: mutation_map_Saliva.svg

Saved: mutation_map_Urine.svg

Shannon Entropy

Code
combined_df["Freq_Ref"] = combined_df["Allelic_Depth_Ref"] / combined_df["Total_Depth"]
combined_df["Freq_Alt"] = combined_df["Allelic_Depth_Alt"] / combined_df["Total_Depth"]

def calculate_entropy(row):
    freqs = np.nan_to_num([row["Freq_Ref"], row["Freq_Alt"]], nan=0.0)
    return entropy(freqs, base=np.e)

combined_df["Entropy"] = combined_df.apply(calculate_entropy, axis=1)
print(f"Entropy range: {combined_df['Entropy'].min():.4f}{combined_df['Entropy'].max():.4f}")
combined_df[["Position", "Segment", "Source", "Variant_Threshold", "Entropy"]].head(10)
Entropy range: 0.0537 – 0.4990
Position Segment Source Variant_Threshold Entropy
0 304 S Saliva 2% 0.106827
1 366 S Saliva 2% 0.217199
2 1574 S Saliva 2% 0.263026
3 1613 S Saliva 2% 0.172522
4 1717 S Saliva 2% 0.110554
5 1290 M Urine 5% 0.482915
6 1833 M Urine 5% 0.497796
7 2342 M Urine 5% 0.365460
8 3644 M Urine 5% 0.458609
9 3647 M Urine 5% 0.497180

Entropy Heatmaps

Code
custom_cmap = sns.color_palette("Blues", as_cmap=True)

for seg in SEGMENT_CONFIG:
    seg_df = combined_df[
        (combined_df["Segment"] == seg) &
        (combined_df["Source"].isin(TISSUE_TYPES))
    ]

    pivot = (
        seg_df
        .groupby(["Source", "Position"])["Entropy"]
        .mean()
        .unstack(fill_value=0)
    )

    if pivot.empty:
        print(f"No data for {seg} segment — skipping heatmap")
        continue

    g = sns.clustermap(
        pivot,
        cmap=custom_cmap,
        row_cluster=True,
        col_cluster=False,
        figsize=(12, max(2, len(pivot) * 0.8 + 1)),
        linewidths=0,
        cbar_pos=(1.05, 0.2, 0.03, 0.6),
        xticklabels=False,
    )
    g.ax_heatmap.set_xlabel("Genomic position (nt)")
    g.ax_heatmap.set_ylabel("Tissue source")
    g.fig.suptitle(f"{seg} segment — Shannon Entropy by Source", y=1.02, fontsize=12)

    out_svg = os.path.join(OUTPUT_DIR, f"entropy_map_{seg}.svg")
    g.fig.savefig(out_svg, format="svg", bbox_inches="tight")
    plt.show()
    print(f"Saved: {out_svg}")

Saved: Plots/entropy_map_S.svg

Saved: Plots/entropy_map_M.svg

Mutation Frequency per Sample

Code
def filter_coding(df):
    masks = []
    for seg, cfg in SEGMENT_CONFIG.items():
        m = (
            (df["Segment"] == seg) &
            (df["Position"].between(cfg["cds_start"], cfg["cds_end"]))
        )
        masks.append(m)
    combined_mask = masks[0]
    for mask in masks[1:]:
        combined_mask = combined_mask | mask
    return df[combined_mask]


coding_df  = filter_coding(combined_df)
analysis_df = coding_df[coding_df["Source"].isin(TISSUE_TYPES)].copy()

freq_rows = []
for (sample_id, source, seg, thresh), grp in analysis_df.groupby(
    ["ID", "Source", "Segment", "Variant_Threshold"]
):
    cfg = SEGMENT_CONFIG[seg]
    n_total  = len(grp)
    n_nonsyn = (grp["Amino_Acid_Change"] != "N/A").sum()

    freq_rows.append({
        "ID":                   sample_id,
        "Source":               source,
        "Segment":              seg,
        "Threshold":            thresh,
        "Mutations_per_1000bp": (n_total / cfg["length"]) * 1000,
        "Mutations_per_100aa":  (n_nonsyn / cfg["aa_length"]) * 100,
    })

freq_df = pd.DataFrame(freq_rows)
print(freq_df.groupby(["Segment", "Threshold"])[
    ["Mutations_per_1000bp", "Mutations_per_100aa"]
].mean().round(2))
freq_df.head()
                   Mutations_per_1000bp  Mutations_per_100aa
Segment Threshold                                           
M       1%                         3.05                 0.85
        2%                         1.77                 0.48
        5%                         1.15                 0.31
S       1%                         3.74                 1.73
        2%                         2.25                 1.02
        5%                         1.31                 0.56
ID Source Segment Threshold Mutations_per_1000bp Mutations_per_100aa
0 SMPL001 Lung M 1% 3.809524 1.145374
1 SMPL001 Lung M 2% 1.904762 0.528634
2 SMPL001 Lung M 5% 1.360544 0.352423
3 SMPL001 Lung S 1% 3.680336 1.944444
4 SMPL001 Lung S 2% 1.577287 0.555556

Mutation Frequency Violin Plots

Code
for seg in SEGMENT_CONFIG:
    seg_freq = freq_df[freq_df["Segment"] == seg]
    if seg_freq.empty:
        continue

    fig, axes = plt.subplots(1, 2, figsize=(10, 4), constrained_layout=True)
    fig.suptitle(f"{seg} segment — Mutation Frequency by Source", fontsize=12)

    metrics = [
        ("Mutations_per_1000bp", "Mutations per 1,000 bp"),
        ("Mutations_per_100aa",  "Non-syn. mutations per 100 aa"),
    ]
    for ax, (col, label) in zip(axes, metrics):
        sns.violinplot(
            data=seg_freq[seg_freq["Source"].isin(TISSUE_TYPES)],
            x="Source", y=col, hue="Threshold",
            palette=VAF_COLORS, order=TISSUE_TYPES,
            inner="quartile", ax=ax,
        )
        ax.set_xlabel("Tissue type")
        ax.set_ylabel(label)
        ax.set_title(label)

    fig.savefig(os.path.join(OUTPUT_DIR, f"mutation_freq_{seg}.svg"),
                format="svg", bbox_inches="tight")
    plt.show()

Kruskal–Wallis Tests

Code
kruskal_rows = []

metrics = [
    ("Mutations_per_1000bp", "Nucleotide (per 1,000 bp)"),
    ("Mutations_per_100aa",  "Amino acid (per 100 aa)"),
]

for thresh in VAF_THRESHOLDS:
    t_df = freq_df[freq_df["Threshold"] == thresh]
    for seg in SEGMENT_CONFIG:
        s_df = t_df[t_df["Segment"] == seg]
        for col, metric_label in metrics:
            groups = [s_df[s_df["Source"] == src][col].dropna()
                      for src in TISSUE_TYPES]
            groups = [g for g in groups if len(g) >= 2]
            if len(groups) < 2:
                continue
            stat, pval = kruskal(*groups)
            kruskal_rows.append({
                "Threshold":   thresh,
                "Segment":     seg,
                "Metric":      metric_label,
                "Statistic":   round(stat, 4),
                "p-value":     round(pval, 4),
                "Significant": pval < 0.05,
            })

kruskal_df = pd.DataFrame(kruskal_rows)
kruskal_df.to_csv(os.path.join(OUTPUT_DIR, "kruskal_results.csv"), index=False)
print("Kruskal–Wallis results:")
kruskal_df
Kruskal–Wallis results:
Threshold Segment Metric Statistic p-value Significant
0 1% S Nucleotide (per 1,000 bp) 1.5857 0.4526 False
1 1% S Amino acid (per 100 aa) 0.9485 0.6223 False
2 1% M Nucleotide (per 1,000 bp) 0.2406 0.8867 False
3 1% M Amino acid (per 100 aa) 0.3942 0.8211 False
4 2% S Nucleotide (per 1,000 bp) 0.3483 0.8402 False
5 2% S Amino acid (per 100 aa) 0.1621 0.9222 False
6 2% M Nucleotide (per 1,000 bp) 1.6571 0.4367 False
7 2% M Amino acid (per 100 aa) 2.9753 0.2259 False
8 5% S Nucleotide (per 1,000 bp) 0.8281 0.6610 False
9 5% S Amino acid (per 100 aa) 0.6719 0.7146 False
10 5% M Nucleotide (per 1,000 bp) 1.2049 0.5475 False
11 5% M Amino acid (per 100 aa) 0.9969 0.6075 False

Summary Table

Code
summary = (
    freq_df
    .groupby(["Segment", "Threshold", "Source"])[
        ["Mutations_per_1000bp", "Mutations_per_100aa"]
    ]
    .agg(["mean", "std"])
    .round(3)
)
summary.columns = ["_".join(c) for c in summary.columns]
summary.reset_index().to_csv(os.path.join(OUTPUT_DIR, "mutation_summary.csv"), index=False)
print("Saved: mutation_summary.csv")
summary
Saved: mutation_summary.csv
Mutations_per_1000bp_mean Mutations_per_1000bp_std Mutations_per_100aa_mean Mutations_per_100aa_std
Segment Threshold Source
M 1% Lung 3.039 0.676 0.852 0.213
Saliva 2.993 0.770 0.808 0.252
Urine 3.129 0.784 0.896 0.258
2% Lung 1.950 0.469 0.543 0.117
Saliva 1.542 0.477 0.426 0.103
Urine 1.814 0.444 0.485 0.134
5% Lung 1.270 0.281 0.323 0.120
Saliva 1.134 0.401 0.338 0.152
Urine 1.043 0.401 0.279 0.130
S 1% Lung 3.593 0.906 1.667 0.430
Saliva 3.505 0.718 1.620 0.409
Urine 4.118 0.965 1.898 0.567
2% Lung 2.366 0.644 1.019 0.380
Saliva 2.103 0.880 0.972 0.421
Urine 2.278 0.921 1.065 0.478
5% Lung 1.227 0.543 0.509 0.409
Saliva 1.227 0.921 0.509 0.369
Urine 1.490 0.699 0.648 0.380